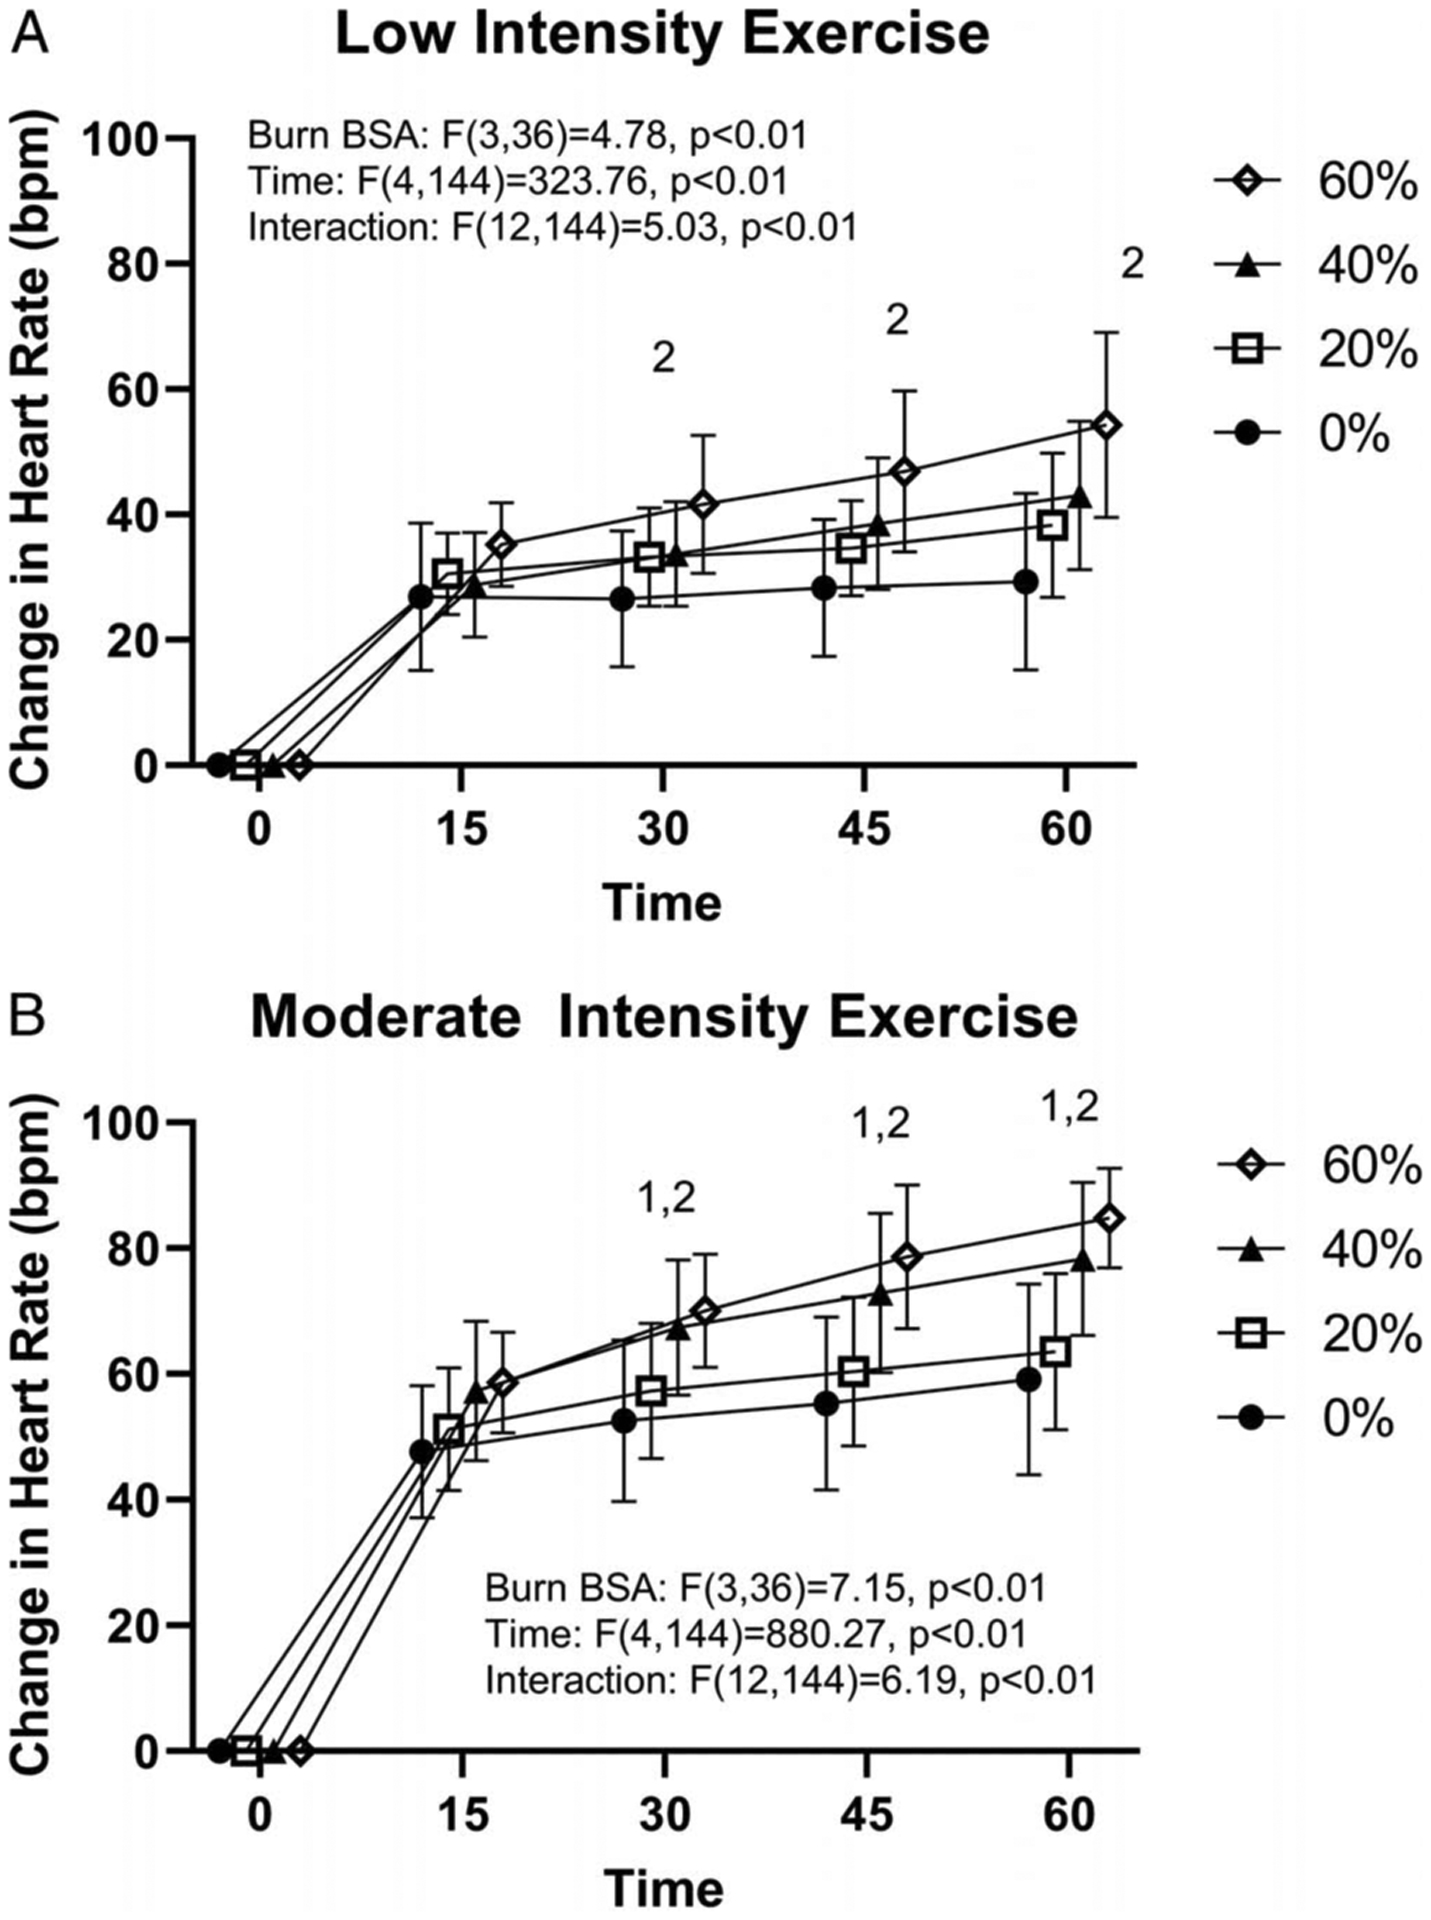
FIGURE 3—

Change in heart rate during 60 min of exercise at low (A, ~4 W·kg−1) and moderate (B, ~6 W·kg−1) exercise intensity with 0%, 20%, 40%, or 60% simulated BSA burn. 140% simulated burn different from 0% at the indicated time points within exercise intensity (P < 0.05). 260% simulated burn different from 0% at the indicated time points within exercise intensity (P < 0.05). For the moderate-intensity trial, one 40% and three 60% simulated burn values for the 60-min time point are end of exercise values due to these participants ending exercise prematurely (see text for details).
