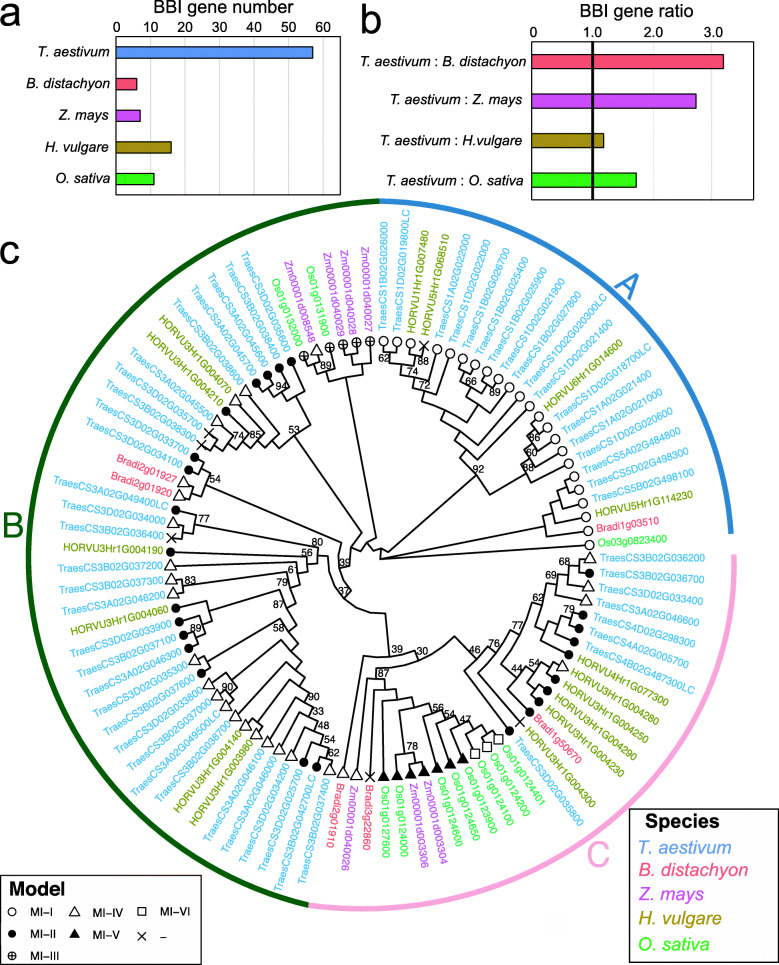
Fig. 3.
Comparison of the wheat BBI gene family with other monocots. a Total number of BBI genes in monocot genomes. Bars are color-coded based on species. b Ratios of total BBI gene numbers in common wheat compared to other monocot species, adjusted for wheat’s hexaploid genome. The 1:1 ratio is indicated by a bold line. c Circular phylogenetic tree of all BBI proteins from rice, maize, barley, Brachypodium and common wheat. Only bootstrap support values below 95 are indicated on the tree. Gene labels are color-coded by species and includes the BBI group based on the classification of Mello et al. [36]

