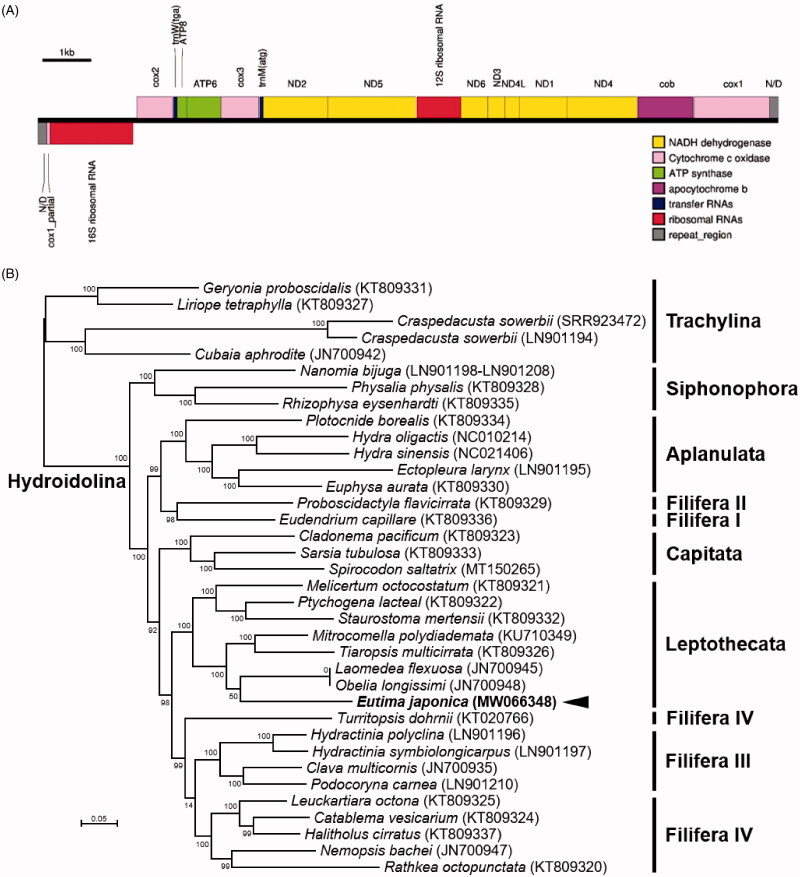
Figure 1.
(A) Schematic diagram for the linear genomic structure of E. japonica mitogenome. (B) Maximum-likelihood (ML) phylogeny of 36 hydrozoans including E. japonica based on the concatenated nucleotide sequences of entire protein-coding genes (PCGs). Numbers at nodes represent ML bootstrap percentages (1000 replicates). DDBJ/EMBL/Genbank accession numbers for published sequences are incorporated. The black arrow indicates the Eutima sp. analyzed in this study.

