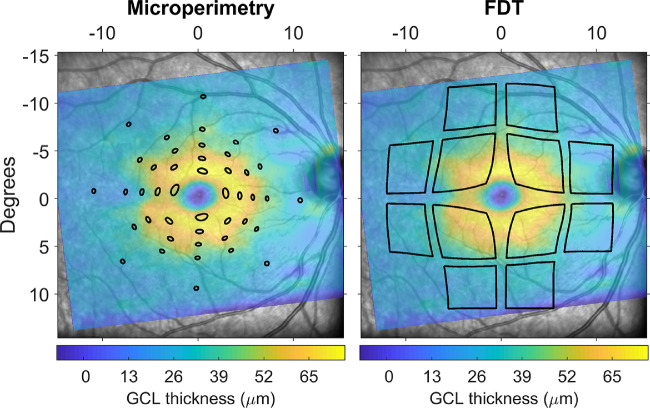
Figure 1.
Schematic of the stimulus displacement applied for the topographic structure-function analysis, overlaid to the GCL thickness map from the Spectralis SD-OCT. Areas enclosed within the black lines were used for calculations. Microperimetric stimuli were mapped by aligning the fundus images from the MAIA and the Spectralis. FDT stimuli were centered on the fovea.

