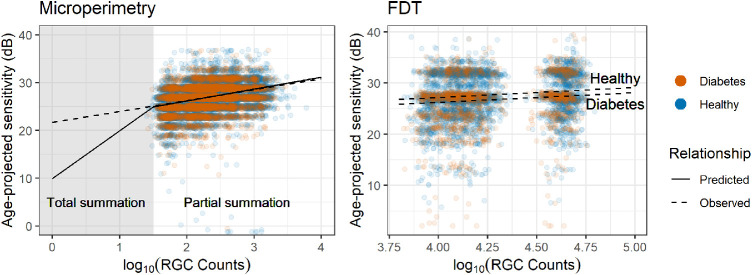
Figure A2.
Observed structure-function relationship compared to the theoretical framework of spatial summation. The observed relationship for the FDT is plotted as two separate lines to reflect the significant difference in intercepts between the diabetic and healthy participants. Sensitivity is projected to the average age of the sample (58 years old).

