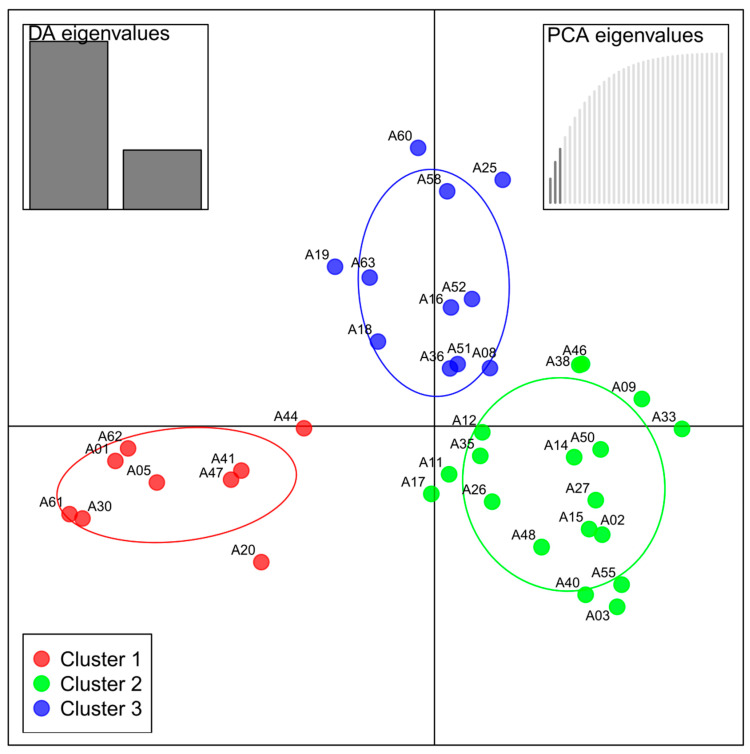
Figure 2.
Scatter plot of discriminant analysis of principal components (DAPC) for SSR-data, three PCs and three DAs retained. Color code and group-ellipses according to the three calculated clusters. The box on the upper left shows the retained DA eigenvalues, while the box on the upper right shows that three PCA eigenvalues have been retained.

