
Figure 2.
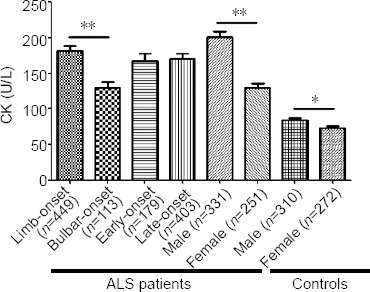
Subgroup analysis of serum CK levels in ALS patients and controls.
Data are expressed as the mean ± SD and analyzed using the Student’s t-test. *P = 0.0064, **P < 0.0001. ALS: Amyotrophic lateral sclerosis; CK: creatine kinase.
Official websites use .gov
A
.gov website belongs to an official
government organization in the United States.
Secure .gov websites use HTTPS
A lock (
) or https:// means you've safely
connected to the .gov website. Share sensitive
information only on official, secure websites.
Subgroup analysis of serum CK levels in ALS patients and controls.
Data are expressed as the mean ± SD and analyzed using the Student’s t-test. *P = 0.0064, **P < 0.0001. ALS: Amyotrophic lateral sclerosis; CK: creatine kinase.