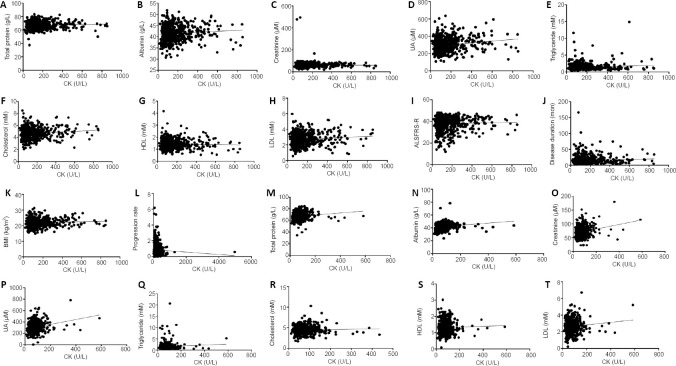
Figure 3.
Correlation analysis between CK and other serological variables in ALS patients and controls.
(A–L) Correlation analysis between CK and other serological variables in ALS patients. CK in the ALS patients was positively correlated with total protein (r = 0.1028, P = 0.0132; A), albumin (r = 0.1339, P = 0.0012; B), creatinine (r = 0.0012, P = 0.0287; C), UA (r = 0.1916, P < 0.0001; D), cholesterol (r = 0.1133, P = 0.0063; F), LDL (r = 0.09074, P = 0.0287; H), and disease duration (r = 0.1200, P = 0.0037; J). CK in the ALS patients was not correlated with triglycerides (r = 0.03849, P = 0.3544; E), HDL (r = –0.01237, P = 0.7660; G), ALSFRS-R (r = –0.01015, P = 0.8070; I), BMI (r = 0.04862, P = 0.2415; K), or progression rate (r = –0.06878, P = 0.0974; L). (M–T) Correlation analysis between CK and other serological variables in healthy controls. CK in the healthy controls was positively correlated with total protein (r = 0.1361, P = 0.0011; M), albumin (r = 0.1846, P < 0.0001; N), creatinine (r = 0.2207, P < 0.0001; O), UA (r = 0.2363, P < 0.0001; P), cholesterol (r = 0.1162, P = 0.0055; R), and LDL (r = 0.1003, P = 0.0165; T). CK in the healthy controls was not correlated with triglycerides (r = 0.07056, P = 0.0921; Q) or HDL (r = 0.03044, P = 0.4679; S). All data were analyzed using Spearman’s correlation. ALS: Amyotrophic lateral sclerosis; ALSFRS-R: ALS Functional Rating Scale-Revised; BMI: body mass index; CK: creatine kinase; HDL: high-density lipoprotein; LDL: low-density lipoprotein; UA: uric acid.

