Keywords: cells, factors, inflammation, microglia, pain, pathway, protein, RNA
Abstract
Several studies have confirmed that microglia are involved in neuropathic pain. Inhibition of guanosine-5′-triphosphate cyclohydrolase 1 (GTPCH1) can reduce the inflammation of microglia. However, the precise mechanism by which GTPCH1 regulates neuropathic pain remains unclear. In this study, BV2 microglia were transfected with adenovirus to knockdown GTPCH1 expression. High throughput sequencing analysis revealed that the mitogen-activated protein kinase (MAPK) related pathways and proteins were the most significantly down-regulated molecular function. Co-expression network analysis of Mapk14 mRNA and five long noncoding RNAs (lncRNAs) revealed their correlation. Quantitative reverse transcription-polymerase chain reaction revealed that among five lncRNAs, ENSMUST00000205634, ENSMUST00000218450 and ENSMUST00000156079 were related to the downregulation of Mapk14 mRNA expression. These provide some new potential targets for the involvement of GTPCH1 in neuropathic pain. This study is the first to note the differential expression of lncRNAs and mRNA in GTPCH1 knockdown BV2 microglia. Findings from this study reveal the mechanism by which GTPCH1 activates microglia and provide new potential targets for microglial activation in neuropathic pain.
Chinese Library Classification No. R446; R741; R441.1
Introduction
Neuropathic pain (NP) is a common chronic disease affecting neurons. It causes significant impairments in the quality of life and a heavy economic burden on society (Colloca et al., 2017). The incidence of NP is 7–10% of the population worldwide (van Hecke et al., 2014; Alles and Smith, 2018). NP is mainly characterized by increased reactivity of nociceptive neurons in the peripheral and central nervous systems (Latremoliere and Woolf, 2009; Batista et al., 2019). The sensitivity of central and peripheral nervous systems to pain is caused by changes in the numerous functional proteins and signaling pathways of neurons and glial cells, such as microglia and astrocytes (LaCroix-Fralish et al., 2011). Although the pathogenesis of NP is unclear, microglial involvement in NP has been confirmed by many studies. Microglial cells participate in NP by releasing proinflammatory cytokines (Woolf, 2011; Inoue and Tsuda, 2018; Oh et al., 2020). They can also reduce neuronal apoptosis by reducing their release of pro-inflammatory cytokines (Rahimifard et al., 2017).
Guanosine-5′-triphosphate cyclohydrolase 1 (GTPCH1) is a member of the guanosine-5′-triphosphate cyclohydrolase family. The protein expressed by the GTPCH1 gene is a rate-limiting enzyme in the folic acid and biopterin biosynthetic pathways. It is responsible for the hydrolysis of guanosine triphosphate to form 7,8-dihydropterine triphosphate. GTPCH1 plays an important role in the pathogenesis of many diseases including NP (Tegeder et al., 2006; Young et al., 2012), Parkinson’s disease (Terbeek et al., 2015) and tumors (Cronin et al., 2018). Though research has shown that inhibition of GTPCH1 can reduce the microglial inflammatory response, its specific mechanism of action is unclear.
Long noncoding RNA (lncRNA) is an important class of noncoding RNA whose transcription sequence has more than 200 nucleotides (Ponting et al., 2009). lncRNAs were originally thought to be a by-product of transcription. However, recent studies have found that they can be involved in gene expression by regulating transcription, post-transcriptional processing, chromatin remodeling and the production of small noncoding RNAs, among other processes (Batista and Chang, 2013; Bali and Kuner, 2014; Li et al., 2019b). Additionally, lncRNAs are involved in various aspects of cell biology and disease etiology, such as cancer development (Mestdagh et al., 2010) and neurological diseases (Faghihi et al., 2008; Zhao et al., 2017). Unique lncRNAs are expressed in specific cell types, which results in specific disease states. Cognizant of this, lncRNAs not only serve as diagnostic and prognostic markers but also reveal the mechanisms of transcription and translation in NP. However, their underlying mechanism is still not clear.
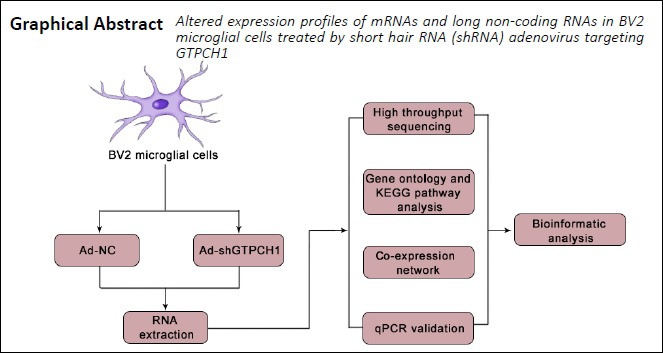
To further study the new targets of NP, we conducted high-throughput sequencing and bioinformatics analysis of GTPCH1 knockdown BV2 microglia cells treated with adenovirus. Their RNA was extracted and analyzed, and the results were verified by quantitative real-time polymerase chain reaction (PCR).
Materials and Methods
Cell culture and RNA isolation
BV2 microglia cells were purchased from the Cell Resource Center of the Institute of Basic Medical Sciences, Chinese Academy of Medical Sciences (resource No. 3111C0001CCC000063). Following the manufacturer’s instructions, they were cultured in Dulbecco’s modified Eagle medium high glucose (HyClone, Logan, UT, USA) media containing 10% fetal bovine serum (Scitecher, France). Half the cells of this subline provided the negative control group (Ad-NC). The other half were then infected with 1 × 10⁹ titer adenovirus (Cat# L2019-180SH; GenePharma, Shanghai, China) for 48 hours to give the experimental group (Ad-shGTPCH1). Total RNA in the BV2 cells was isolated using TRIzol reagent (Invitrogen Life Technologies, Carlsbad, CA, USA) according to the manufacturer’s instructions. The quality and quantity of the RNA was assessed using a NanoDrop ND-1000 spectrophotometer (Illumina Inc., San Diego, CA, USA). Finally, the integrity of the RNA was determined using denaturing agarose gel electrophoresis.
High throughput sequencing
Total RNA was first removed using the Ribo-Zero Magnetic Gold Kit (Epicentre, Illumina Inc.). The processed product RNA was constructed with KAPA Stranded RNA-Seq Library Prep Kit (Illumina Inc.). The constructed library was tested by Agilent 2100 Bioanalyzer (Agilent, Santa Clara, CA, USA) and the library was quantified using quantitative PCR (see below). Sequencing libraries of different mixed samples were denatured to generate single-stranded DNA by 0.1 M NaOH, diluted to 8 pM concentration and then amplified in situ on the NovaSeq6000 S4 Reagent Kit (300 cycles; Illumina Inc.). The sequencer sequenced 150 cycles.
Identification and differential expression analysis of lncRNA and mRNA
The StringTie software (https://ccb.jhu.edu/software/stringtie/ is used to proofread gene transcriptome data (Pertea et al., 2015). Fragments per kilobase million (Mortazavi et al., 2008) are calculated by R software ballgown (https://www.r-project.org/ (Frazee et al., 2015; Pertea et al., 2016) at the gene and transcript levels. Differentially expressed genes were calculated at the gene level and transcript level to screen for the differentially expressed genes between the groups. Principal component analysis and correlation analysis at the gene expression level, clustering of differentially expressed genes, gene ontology (GO) function significance enrichment analysis and pathway significance enrichment analysis, among other analyses, were then conducted. Differential expression analysis of lncRNA and mRNA using DESeq (version 1.18.0;https://bioconductor.org/packages/release/bioc/html/DESeq.html was also performed. The filter conditions were set at a P-value of < 0.05 and a fold change of > 1.5.
GO and KEGG pathway analysis
GO (www.geneontology.org) analysis was used to analyze the biological functions such as biological processes, cellular components, and molecular functions of all differentially expressed genes. The Enrichment score is calculated by P-value (–log10). The larger the Enrichment score, the more susceptible to experimental factors in a certain GO term.
Kyoto Gene and Genome Encyclopedia (KEGG;http://www.genome.ad.jp/kegg/ is a utility database resource for studying advanced features and biological systems (Kanehisa et al., 2002). KEGG was used to analyze the signaling pathways for the differentially expressed genes. P values of < 0.05 were statistically significant.
Coding-non-coding gene co-expression analysis
The five lncRNAs related to mitogen-activated protein kinase (MAPK) in GO analysis were selected for this analysis by constructing them as a network of coding-noncoding gene co-expression. Absolute Pearson correlation coefficients > 0.8 and P values < 0.05 were used as critical values. The networks were drawn using Cytoscape 2.8.3 (https://cytoscape.org/.
Validation of the differentially expressed lncRNAs and mRNAs by quantitative real-time PCR
Total RNA was extracted from the Ad-shGTPCH1 and Ad-NC groups using the TRIzol regent (Invitrogen Life Technologies). The RNA was then transcribed into its complementary DNA using a reverse transcription kit (SuperScript™ III Reverse Transcriptase, Invitrogen Life Technologies). The sequences of the lncRNA and mRNA primers are given in Table 1. ABI QuantStudio™ 6 Flex System and SYBR-Green PCR Master Mix Kit (Applied Biosystems, Inc., Foster City, CA, USA) were then used for real-time PCR. Amplification conditions were set at an initial denaturation of 95°C for 10 minutes followed by 40 cycles of denaturation, annealing and extension at 95°C for 10 seconds, 60°C for 60 seconds and 95°C for 15 seconds respectively. The lncRNA and mRNA concentration was calculated based on the standard curve of gradient dilution DNA. The relative expression of different lncRNAs and mRNA was normalized to reference gene GAPDH.
Table 1.
Overview of RNA primer sequences
| Gene name | Bidirectional primer sequences | Annealing temperature (°C) | Product size (bp) |
|---|---|---|---|
| GAPDH (mouse) | F: 5′-CAC TGA GCA AGA GAG GCC CTA T-3′ | 60 | 144 |
| R: 5′-GCA GCG AAC TTT ATT GAT GGT ATT-3′ | |||
| ENSMUST00000125824 | F: 5′-ACA GTT AAG ACC TAG CCT CTC GG-3′ | 60 | 157 |
| R: 5′-ATG GTT GGC GGA GTT TGT TAT-3′ | |||
| ENSMUST00000156079 | F: 5′-CGA GGA GAT CCA CAC ACA GGC-3′ | 60 | 108 |
| R: 5′-TCA GGC ACT TCT TCA CAT ACT TC-3′ | |||
| ENSMUST00000180643 | F: 5′-AGA GGT AGG AAC TTA GGG GC-3′ | 60 | 256 |
| R: 5′-CAG TAG CCT TGA TCC TCA CAA-3′ | |||
| ENSMUST00000205634 | F: 5′-TGT GAG GGA AGC TCT AGC AAA-3′ | 60 | 130 |
| R: 5′-AGA CCC AAG CCA GAT GAG AAG-3′ | |||
| ENSMUST00000218450 | F: 5′-CAA CCA TTC GTG GCC TGT G-3′ | 60 | 59 |
| R: 5′-ACA ACC TGA ACC GCT ACA CCA-3′ | |||
| Mapk14 | F: 5′-CCT GTT GCT GAC CCT TAT GAC-3′ | 60 | 82 |
| R: 5′-CTT CAT CAT AGG TCA GGC TCT TC-3′ |
F: Forward; GAPDH: glyceraldehyde 3-phosphate dehydrogenase; Mapk14: mitogen-activated protein kinase 14; R: reverse.
Statistical analysis
Data were expressed as the mean ± standard deviation (SD) of three independent experiments. Student’s t-test was used to analyze the differences between the groups. Statistical analysis was conducted using SPSS 20.0 software (IBM, Armonk, NY, USA). P values < 0.05 were considered statistically significant. Pearson correlation analysis was used to test the correlation between differentially expressed lncRNA and mRNA to study their co-expression.
Results
Differentially expressed lncRNAs and mRNAs in BV2 cells with low expression of GTPCH1
Overall, 6619 lncRNAs were obtained from both the Ad-shGTPCH1 and Ad-NC groups (Figure 1A). Compared with the Ad-NC group, 47 lncRNAs were upregulated and 27 downregulated in the Ad-shGTPCH1 group (P < 0.05; Figure 1C). High-throughput sequencing of mRNA profiles detected 22,499 mRNAs in both the Ad-shGTPCH1 and Ad-NC groups (Figure 1B). Among them, 155 were significantly upregulated and 168 downregulated in the Ad-shGTPCH1 group compared with those in the Ad-NC group (P < 0.05; Figure 1D).
Figure 1.
Altered expression profiles of mRNAs and long non-coding RNAs in BV2 microglial cells treated by Ad-shGTPCH1 and Ad-NC.
(A, B) Clustering maps of all lncRNA (A) and mRNA (B) detected in Ad-shGTPCH1 (blue bar) and Ad-NC (pink bar) groups. Red indicates that the relative gene expression level is high, and green indicates that the relative gene expression level is low. (C, D) Volcano plots of all lncRNA (C) and mRNA (D) expressions were detected in the Ad-shGTPCH1 and Ad-NC groups. The X-axis represents conversion of the multiple of the difference to a base 2 logarithmic value (log2 (fold change)), and the Y-axis represents conversion of the significance level to a negative logarithmic value (–log10 (P value)). Red dots represent significantly up-regulated genes with > 1.5-fold changes, green dots represent significantly down-regulated genes with > 1.5-fold changes, while black dots represent lack of significant differences between the two groups. GTPCH1: Guanosine-5′-triphosphate cyclohydrolase 1; lncRNA: long non-coding RNA.
Functions of the altered mRNAs and their related biological pathways
GO analysis was conducted to analyze the regulatory networks of mRNAs with altered gene function expression such as biological processes, cellular components, and molecular function. Among the biological processes, the tetrahydrobiopterin biosynthetic process (GO: 0006729; Figure 2A) was the most significantly downregulated and the myelin assembly (GO: 0032288; Figure 2B) was the most upregulated in the Ad-shGTPCH1 group. Intracellular membrane-bounded organelle (GO: 0043231; Figure 2A) and compact myelin (GO: 0043218; Figure 2B) were the most significantly downregulated and upregulated cell components in the Ad-shGTPCH1 group, respectively. At the level of molecular functions, mitogen-activated protein kinase (GO: 0051019; Figure 2A) and transferase activity (GO: 0016740; Figure 2B) were the most significantly downregulated and upregulated in the Ad-shGTPCH1 group, respectively. KEGG analysis was applied to signaling pathways for the differentially expressed genes but found no up-regulated pathways and only the folate biosynthesis pathway was downregulated (Figure 3).
Figure 2.
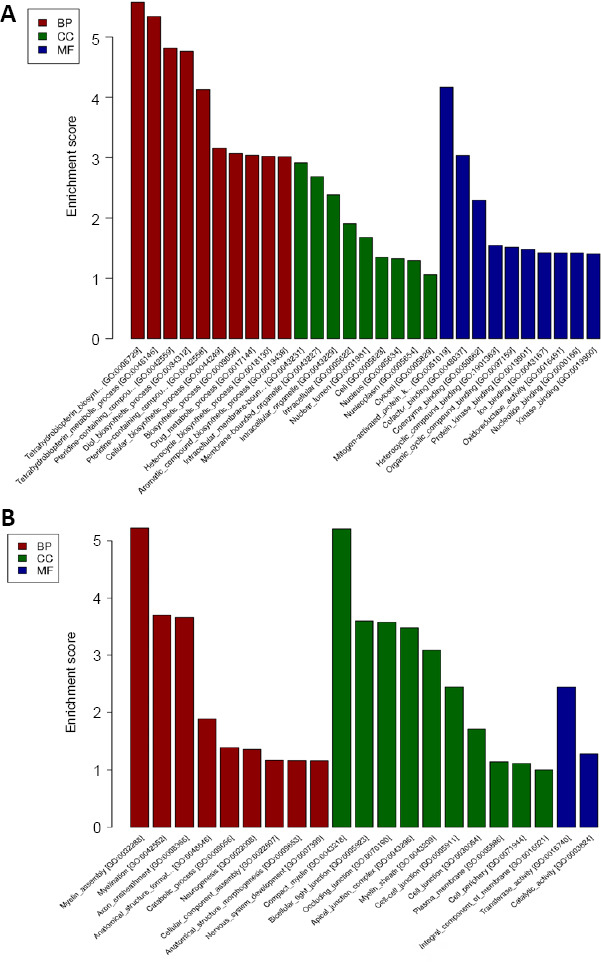
The top 10 significantly enriched down-regulated genes (A) and up-regulated genes (B) in BV2 microglial cells treated by Ad-shGTPCH1 and Ad-NC.
Applying GO analysis to elucidate genetic regulatory networks based on differentially expressed mRNAs in MF, BP, and CC classes. The higher Enrichment score, the more susceptible to experimental factors in a certain GO term. The red bar graph represents up and down GO terms in biological processes, the green bar graph represents up and down GO terms in cellular components while the blue bar graph represents up and down GO terms in molecular functions. BP: Biological processes; CC: cell component; GO: Gene Ontology; MF: molecular functions.
Figure 3.
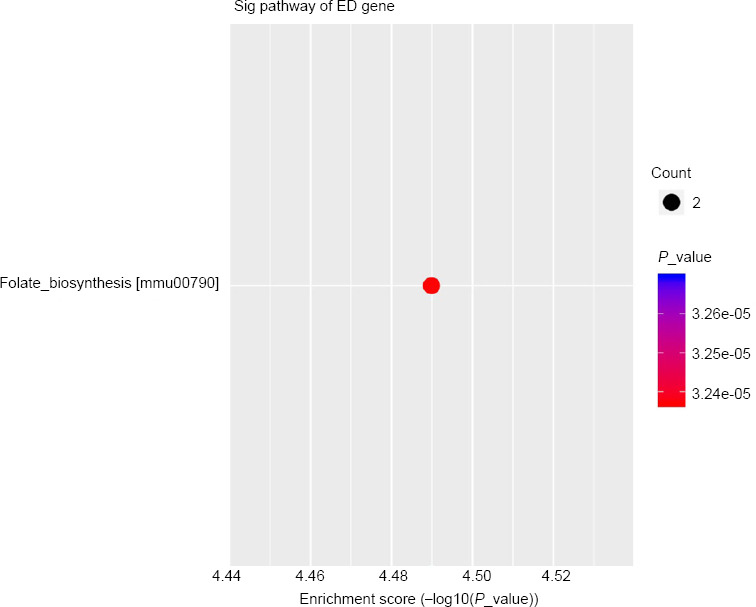
KEGG pathways for Ad-shGTPCH1 and Ad-NC in BV2 microglial cells.
The most significantly enriched KEGG pathways are represented by bubbles. The Y-axis represents the enrichment factor and refers to the amount of mRNA downregulated in the folate synthesis pathway relative to the total mRNA. The size of the bubbles indicates the average number of mRNAs enriched in a given pathway. The color of the bubble indicates the P value (adjusted P value). KEGG: Kyoto Encyclopedia of Genes and Genomes.
Coding-noncoding gene co-expression in BV2 microglial cells treated by Ad-shGTPCH1 and Ad-NC
Five lncRNAs, ENSMUST00000156079, ENSMUST00000180643, ENSMUST00000205634, ENSMUST00000218450, and ENSMUST00000125824, were co-expressed with many mRNAs. In particular, ENSMUST00000205634, ENSMUST00000218450, and ENSMUST00000156079 were positively co-expressed with mitogen-activated protein kinase 14 (Mapk14) mRNA (Figure 4).
Figure 4.
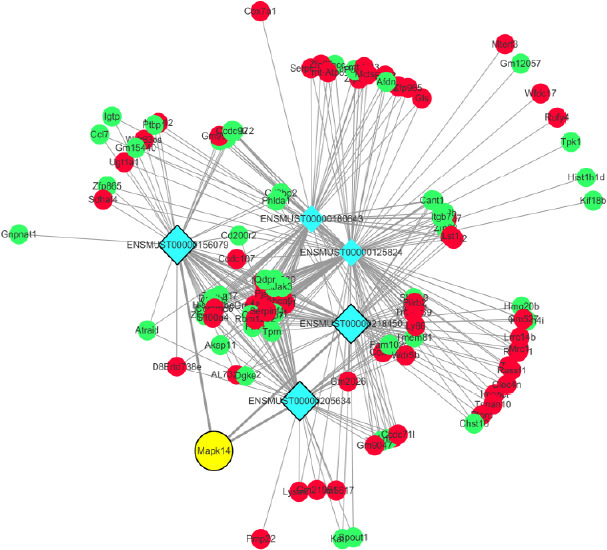
Analysis of co-expression networks of five differentially expressed lncRNAs and interacting differentially expressed mRNAs.
The blue circle represents lncRNA, the green circle represents its related down-regulated mRNA while the red circle represents its related up-regulated mRNA. The yellow circle represents Mapk14 mRNA. lncRNA: Long non-coding RNA; Mapk14: mitogen-activated protein kinase 14.
Quantitative real-time PCR validation for high throughput sequencing data in BV2 microglial cells treated by Ad-shGTPCH1 and Ad-NC
Five lncRNAs related to mitogen-activated protein kinase (lncRNAENSMUST00000156079, ENSMUST00000180643, ENSMUST00000205634, ENSMUST00000218450, and ENSMUST00000125824) and Mapk14 mRNA were selected to determine their relative expression levels by real-time PCR (Figure 5). Compared with Ad-NC group, the relative expression levels of ENSMUST00000156079, ENSMUST00000180643, ENSMUST00000205634, ENSMUST00000218450, and Mapk14 mRNA in the Ad-shGTPCH1 group were downregulated. However, there was no change in the relative expression level of ENSMUST00000125824 in BV2 microglial cells treated by Ad-shGTPCH1 compared with Ad-NC.
Figure 5.
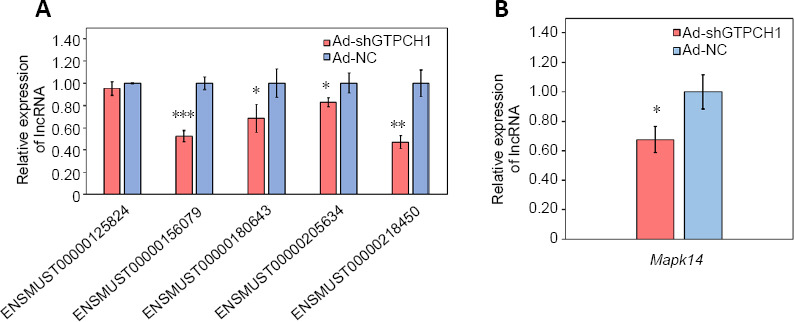
Quantitative real-time polymerase chain reaction results of selected lncRNA (A) and mRNA (B) in BV2 microglial cells treated by Ad-shGTPCH1 and Ad-NC.
All results are expressed as the mean ± SD of three independent experiments. *P < 0.05, **P < 0.01, ***P < 0.001, vs. Ad-NC group (Student’s t-test). lncRNA: Long non-coding RNA; MAPK14: mitogen-activated protein kinase 14.
Discussion
Chronic neuropathic pain affects nearly one-third of the US population and causes great suffering to patients and amounts to an annual spending of hundreds of billions of dollars. There is still a lack of specific drugs or other treatments. LncRNAs participate in important biological processes at the epigenetic level. The use of high-throughput sequencing technology has become an important way to reveal potential therapeutic targets for NP. GTPCH1 is not only a key regulator of peripheral neuropathic and inflammatory pain but also a rate limiting enzyme for the synthesis of tetrahydrobiopterin (BH4). Inflammatory and neuropathic pain results from various regulatory mechanisms of the peripheral and central nervous system. GTPCH1 plays an important role in reducing microglia activation and pathogenesis of NP. Therefore, our results provide some information on the involvement of GTPCH1 in NP from the perspective of epigenetic regulation. Integrated bioinformatics indicated that many lncRNAs are involved in the activation of BV2 microglia cells in vitro (Li et al., 2019a). This provided relevant information for studying the role of microglia in NP. As such, the up- and downregulated lncRNAs and mRNAs may also play a vital role in the pathogenesis of NP.
To explore the lncRNAs regulated by GTPCH1, we detected the expression levels of lncRNAs and mRNAs using high-throughput sequencing in GTPCH1-knockdown BV2 microglia cells. Pathway analysis results showed that differentially expressed lncRNAs and mRNAs were mainly involved in the downregulated folate biosynthesis pathway. GTPCH1 may regulate folate biosynthesis through the KEGG pathway. These GO and KEGG analyses provide many interesting directions for our ongoing research. Mitogen-activated protein kinase (MAPK) was the most significantly down-regulated molecular function in GO analysis.
MAPK comprises two major isoforms: p38α (MAPK14) and p38β. These subtypes (especially p38α) are involved in the local inflammatory cascade in peripheral tissues (Hale et al., 1999). p38α is mainly present in neurons whereas p38β is mainly present in microglia (Svensson et al., 2005). MAPK14 (p38α) was originally identified as a tyrosine phosphorylated protein in activated immune cell macrophages that plays an important role in the induction of inflammatory cytokines. It was found that p38 activation in neuronal cells, microglia, and astrocytes can induce and maintain hyperalgesia (Watkins et al., 2001). Moreover, p38 activation in the spinal cord is an important part of hyperalgesia (Svensson et al., 2003). p38αMAPK is the main p38MAPK isoform in the spinal cord (Luo et al., 2018). It was reported that the neurological, postoperative and Toll-like receptor 4-induced pains were reduced when male mice were intrathecally injected with p38α isoform-specific antisense oligonucleotides. In summary, through the analyses of GO and KEGGS biological information on normal and GTPCH1 knockdown microglia, we found that GTPCH1 possibly regulates the expression level of MAPK14 mRNA through lncRNAs. This finding also provides some new potential targets for GTPCH1 to participate in NP.
In conclusion, this study is the first to outline the differentially expressed lncRNAs and mRNAs in GTPCH1-knockdown BV2 microglia cells. We analyzed the lncRNA-mRNA coexpression network and discovered potential interactive lncRNA-mRNAs involved in the microglia inflammation process. This study explored the lncRNAs and mRNAs regulated by GTPCH1 and revealed a possible mechanism of GTPCH1 in microglia activation. These findings may provide promising targets for microglia activation in NP in vivo. We will verify our current lncRNA information in further animals before future clinical studies. Research into the detailed mechanisms between lncRNAs and NP will also be necessary.
Footnotes
C-Editor: Zhao M; S-Editors: Yu J, Li CH; L-Editors: Yu J, Song LP; T-Editor: Jia Y
Conflicts of interest: The authors have no conflicts of interest to declare.
Financial support: This work was supported by the National Natural Science Foundation of China, Nos. 81572205, 81974345 (both to CYM). The funding sources had no role in study conception and design, data analysis or interpretation, paper writing or deciding to submit this paper for publication.
Institutional review board statement: BV2 microglia are a kind of commercial cells, and do not directly originate from animals or humans. No ethical issues are involved in all experimental procedures and protocols.
Copyright license agreement: The Copyright License Agreement has been signed by all authors before publication.
Data sharing statement: Datasets analyzed during the current study are available from the corresponding author on reasonable request.
Plagiarism check: Checked twice by iThenticate.
Peer review: Externally peer reviewed.
Funding: This work was supported by the National Natural Science Foundation of China, Nos. 81572205 and 81974345 (both to CYM).
References
- 1.Alles SRA, Smith PA. Etiology and pharmacology of neuropathic pain. Pharmacol Rev. 2018;70:315–347. doi: 10.1124/pr.117.014399. [DOI] [PubMed] [Google Scholar]
- 2.Bali KK, Kuner R. Noncoding RNAs: key molecules in understanding and treating pain. Trends Mol Med. 2014;20:437–448. doi: 10.1016/j.molmed.2014.05.006. [DOI] [PMC free article] [PubMed] [Google Scholar]
- 3.Batista CM, Mariano ED, Dale CS, Cristante AF, Britto LR, Otoch JP, Teixeira MJ, Morgalla M, Lepski G. Pain inhibition through transplantation of fetal neuronal progenitors into the injured spinal cord in rats. Neural Regen Res. 2019;14:2011–2019. doi: 10.4103/1673-5374.259624. [DOI] [PMC free article] [PubMed] [Google Scholar]
- 4.Batista PJ, Chang HY. Long noncoding RNAs: cellular address codes in development and disease. Cell. 2013;152:1298–1307. doi: 10.1016/j.cell.2013.02.012. [DOI] [PMC free article] [PubMed] [Google Scholar]
- 5.Colloca L, Ludman T, Bouhassira D, Baron R, Dickenson AH, Yarnitsky D, Freeman R, Truini A, Attal N, Finnerup NB, Eccleston C, Kalso E, Bennett DL, Dworkin RH, Raja SN. Neuropathic pain. Nat Rev Dis Primers. 2017;3:17002. doi: 10.1038/nrdp.2017.2. [DOI] [PMC free article] [PubMed] [Google Scholar]
- 6.Cronin SJF, Seehus C, Weidinger A, Talbot S, Reissig S, Seifert M, Pierson Y, McNeill E, Longhi MS, Turnes BL, Kreslavsky T, Kogler M, Hoffmann D, Ticevic M, da Luz Scheffer D, Tortola L, Cikes D, Jais A, Rangachari M, Rao S, et al. The metabolite BH4 controls T cell proliferation in autoimmunity and cancer. Nature. 2018;563:564–568. doi: 10.1038/s41586-018-0701-2. [DOI] [PMC free article] [PubMed] [Google Scholar]
- 7.Faghihi MA, Modarresi F, Khalil AM, Wood DE, Sahagan BG, Morgan TE, Finch CE, St Laurent G, 3rd, Kenny PJ, Wahlestedt C. Expression of a noncoding RNA is elevated in Alzheimer’s disease and drives rapid feed-forward regulation of beta-secretase. Nat Med. 2008;14:723–730. doi: 10.1038/nm1784. [DOI] [PMC free article] [PubMed] [Google Scholar]
- 8.Frazee AC, Pertea G, Jaffe AE, Langmead B, Salzberg SL, Leek JT. Ballgown bridges the gap between transcriptome assembly and expression analysis. Nat Biotechnol. 2015;33:243–246. doi: 10.1038/nbt.3172. [DOI] [PMC free article] [PubMed] [Google Scholar]
- 9.Hale KK, Trollinger D, Rihanek M, Manthey CL. Differential expression and activation of p38 mitogen-activated protein kinase alpha, beta, gamma, and delta in inflammatory cell lineages. J Immunol. 1999;162:4246–4252. [PubMed] [Google Scholar]
- 10.Inoue K, Tsuda M. Microglia in neuropathic pain: cellular and molecular mechanisms and therapeutic potential. Nat Rev Neurosci. 2018;19:138–152. doi: 10.1038/nrn.2018.2. [DOI] [PubMed] [Google Scholar]
- 11.Kanehisa M, Goto S, Kawashima S, Nakaya A. The KEGG databases at GenomeNet. Nucleic Acids Res. 2002;30:42–46. doi: 10.1093/nar/30.1.42. [DOI] [PMC free article] [PubMed] [Google Scholar]
- 12.LaCroix-Fralish ML, Austin JS, Zheng FY, Levitin DJ, Mogil JS. Patterns of pain: metaanalysis of microarray studies of pain. Pain. 2011;152:1888–1898. doi: 10.1016/j.pain.2011.04.014. [DOI] [PubMed] [Google Scholar]
- 13.Latremoliere A, Woolf CJ. Central sensitization: a generator of pain hypersensitivity by central neural plasticity. J Pain. 2009;10:895–926. doi: 10.1016/j.jpain.2009.06.012. [DOI] [PMC free article] [PubMed] [Google Scholar]
- 14.Li Y, Li Q, Wang C, Li S, Yu L. Long noncoding RNA expression profile in BV2 microglial cells exposed to lipopolysaccharide. Biomed Res Int. 2019a;2019:5387407. doi: 10.1155/2019/5387407. [DOI] [PMC free article] [PubMed] [Google Scholar]
- 15.Li Z, Li X, Chen X, Li S, Ho IHT, Liu X, Chan MTV, Wu WKK. Emerging roles of long non-coding RNAs in neuropathic pain. Cell Prolif. 2019b;52:e12528. doi: 10.1111/cpr.12528. [DOI] [PMC free article] [PubMed] [Google Scholar]
- 16.Luo X, Fitzsimmons B, Mohan A, Zhang L, Terrando N, Kordasiewicz H, Ji RR. Intrathecal administration of antisense oligonucleotide against p38α but not p38β MAP kinase isoform reduces neuropathic and postoperative pain and TLR4-induced pain in male mice. Brain Behav Immun. 2018;72:34–44. doi: 10.1016/j.bbi.2017.11.007. [DOI] [PMC free article] [PubMed] [Google Scholar]
- 17.Mestdagh P, Fredlund E, Pattyn F, Rihani A, Van Maerken T, Vermeulen J, Kumps C, Menten B, De Preter K, Schramm A, Schulte J, Noguera R, Schleiermacher G, Janoueix-Lerosey I, Laureys G, Powel R, Nittner D, Marine JC, Ringnér M, Speleman F, et al. An integrative genomics screen uncovers ncRNA T-UCR functions in neuroblastoma tumours. Oncogene. 2010;29:3583–3592. doi: 10.1038/onc.2010.106. [DOI] [PubMed] [Google Scholar]
- 18.Mortazavi A, Williams BA, McCue K, Schaeffer L, Wold B. Mapping and quantifying mammalian transcriptomes by RNA-Seq. Nat Methods. 2008;5:621–628. doi: 10.1038/nmeth.1226. [DOI] [PubMed] [Google Scholar]
- 19.Oh JY, Hwang TY, Jang JH, Park JY, Ryu Y, Lee H, Park HJ. Muscovite nanoparticles mitigate neuropathic pain by modulating the inflammatory response and neuroglial activation in the spinal cord. Neural Regen Res. 2020;15:2162–2168. doi: 10.4103/1673-5374.282260. [DOI] [PMC free article] [PubMed] [Google Scholar]
- 20.Pertea M, Kim D, Pertea GM, Leek JT, Salzberg SL. Transcript-level expression analysis of RNA-seq experiments with HISAT, StringTie and Ballgown. Nat Protoc. 2016;11:1650–1667. doi: 10.1038/nprot.2016.095. [DOI] [PMC free article] [PubMed] [Google Scholar]
- 21.Pertea M, Pertea GM, Antonescu CM, Chang TC, Mendell JT, Salzberg SL. StringTie enables improved reconstruction of a transcriptome from RNA-seq reads. Nat Biotechnol. 2015;33:290–295. doi: 10.1038/nbt.3122. [DOI] [PMC free article] [PubMed] [Google Scholar]
- 22.Ponting CP, Oliver PL, Reik W. Evolution and functions of long noncoding RNAs. Cell. 2009;136:629–641. doi: 10.1016/j.cell.2009.02.006. [DOI] [PubMed] [Google Scholar]
- 23.Rahimifard M, Maqbool F, Moeini-Nodeh S, Niaz K, Abdollahi M, Braidy N, Nabavi SM, Nabavi SF. Targeting the TLR4 signaling pathway by polyphenols: A novel therapeutic strategy for neuroinflammation. Ageing Res Rev. 2017;36:11–19. doi: 10.1016/j.arr.2017.02.004. [DOI] [PubMed] [Google Scholar]
- 24.Svensson CI, Fitzsimmons B, Azizi S, Powell HC, Hua XY, Yaksh TL. Spinal p38beta isoform mediates tissue injury-induced hyperalgesia and spinal sensitization. J Neurochem. 2005;92:1508–1520. doi: 10.1111/j.1471-4159.2004.02996.x. [DOI] [PubMed] [Google Scholar]
- 25.Svensson CI, Marsala M, Westerlund A, Calcutt NA, Campana WM, Freshwater JD, Catalano R, Feng Y, Protter AA, Scott B, Yaksh TL. Activation of p38 mitogen-activated protein kinase in spinal microglia is a critical link in inflammation-induced spinal pain processing. J Neurochem. 2003;86:1534–1544. doi: 10.1046/j.1471-4159.2003.01969.x. [DOI] [PubMed] [Google Scholar]
- 26.Tegeder I, Costigan M, Griffin RS, Abele A, Belfer I, Schmidt H, Ehnert C, Nejim J, Marian C, Scholz J, Wu T, Allchorne A, Diatchenko L, Binshtok AM, Goldman D, Adolph J, Sama S, Atlas SJ, Carlezon WA, Parsegian A, et al. GTP cyclohydrolase and tetrahydrobiopterin regulate pain sensitivity and persistence. Nat Med. 2006;12:1269–1277. doi: 10.1038/nm1490. [DOI] [PubMed] [Google Scholar]
- 27.Terbeek J, Hermans S, Van Laere K, Vandenberghe W. Parkinson’s disease in GTP cyclohydrolase 1 mutation carriers. Brain. 2015;138:e350. doi: 10.1093/brain/awu324. [DOI] [PMC free article] [PubMed] [Google Scholar]
- 28.van Hecke O, Austin SK, Khan RA, Smith BH, Torrance N. Neuropathic pain in the general population: a systematic review of epidemiological studies. Pain. 2014;155:654–662. doi: 10.1016/j.pain.2013.11.013. [DOI] [PubMed] [Google Scholar]
- 29.Watkins LR, Milligan ED, Maier SF. Spinal cord glia: new players in pain. Pain. 2001;93:201–205. doi: 10.1016/S0304-3959(01)00359-1. [DOI] [PubMed] [Google Scholar]
- 30.Woolf CJ. Central sensitization: implications for the diagnosis and treatment of pain. Pain. 2011;152:S2–15. doi: 10.1016/j.pain.2010.09.030. [DOI] [PMC free article] [PubMed] [Google Scholar]
- 31.Young EE, Lariviere WR, Belfer I. Genetic basis of pain variability: recent advances. J Med Genet. 2012;49:1–9. doi: 10.1136/jmedgenet-2011-100386. [DOI] [PMC free article] [PubMed] [Google Scholar]
- 32.Zhao JY, Liang L, Gu X, Li Z, Wu S, Sun L, Atianjoh FE, Feng J, Mo K, Jia S, Lutz BM, Bekker A, Nestler EJ, Tao YX. DNA methyltransferase DNMT3a contributes to neuropathic pain by repressing Kcna2 in primary afferent neurons. Nat Commun. 2017;8:14712. doi: 10.1038/ncomms14712. [DOI] [PMC free article] [PubMed] [Google Scholar]


