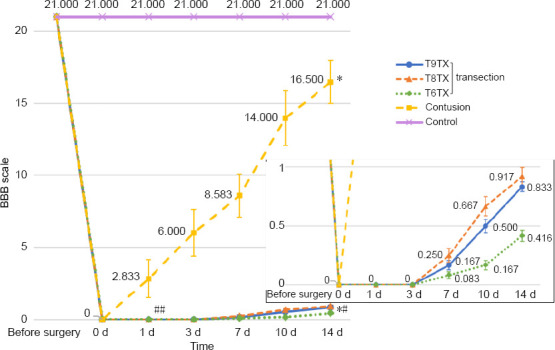
Figure 5.

Basso-Beattie-Bresnahan scores of rats with different types of spinal cord injury.
Data are expressed as the mean ± SD, and analyzed by two-way analysis of variance followed by Student’s t-test. *P < 0.05, vs. control group; #P < 0.05, ##P < 0.01, vs. contusion group. Control group: Rats were fed normally for 2 weeks; contusion group: T9 segment was injured with weight drop, followed by 2 weeks of normal feeding; T9TX2, T8TX, T6TX, and T9TX4 groups: T6/T8/T9 transection, followed by 2 or 4 weeks of normal feeding.
