Figure.

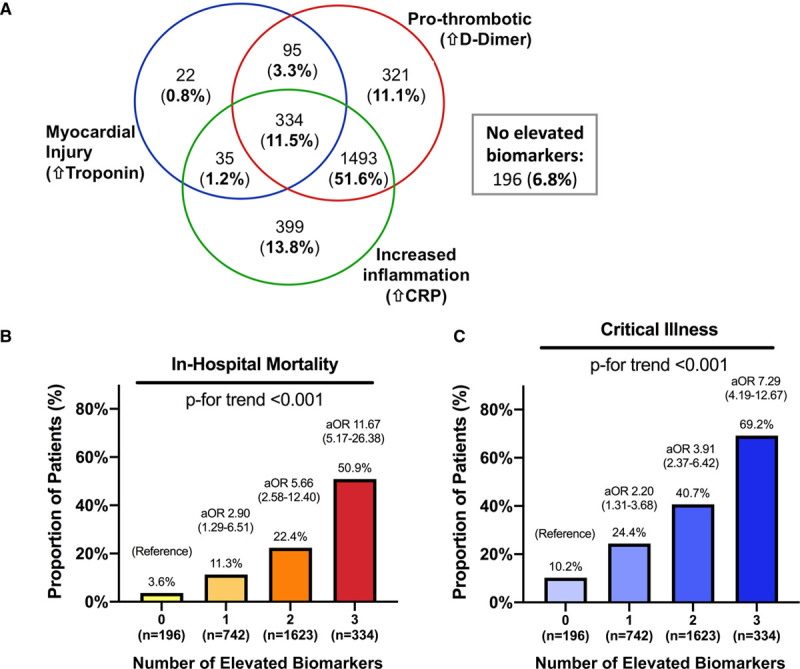
The frequency of elevated biomarkers reflecting myocardial injury, coagulation, and inflammation in COVID-19 and associations with in-hospital outcomes. A, Venn diagram illustrating overlap of elevated biomarkers at the time of initial hospital presentation in patients with COVID-19 and ≥1 elevated biomarker (n=2699). One hundred ninety-six patients had no elevated biomarkers. The proportion of patients with in-hospital mortality (B) and critical illness (C) are shown stratified by the number of elevated biomarkers measured at hospital presentation with COVID-19. Odds ratios (versus 0 biomarkers elevated) shown in B and C are adjusted for age, sex, race, body mass index, tobacco use, hypertension, hyperlipidemia, diabetes, chronic kidney disease, prior myocardial infarction, prior heart failure, atrial fibrillation, temperature at presentation, pulse oximetry at presentation, and outpatient prescriptions for antiplatelets, statin, and β-blockers. aOR indicates adjusted odds ratio; and CRP, C-reactive protein.
