
Figure 3.
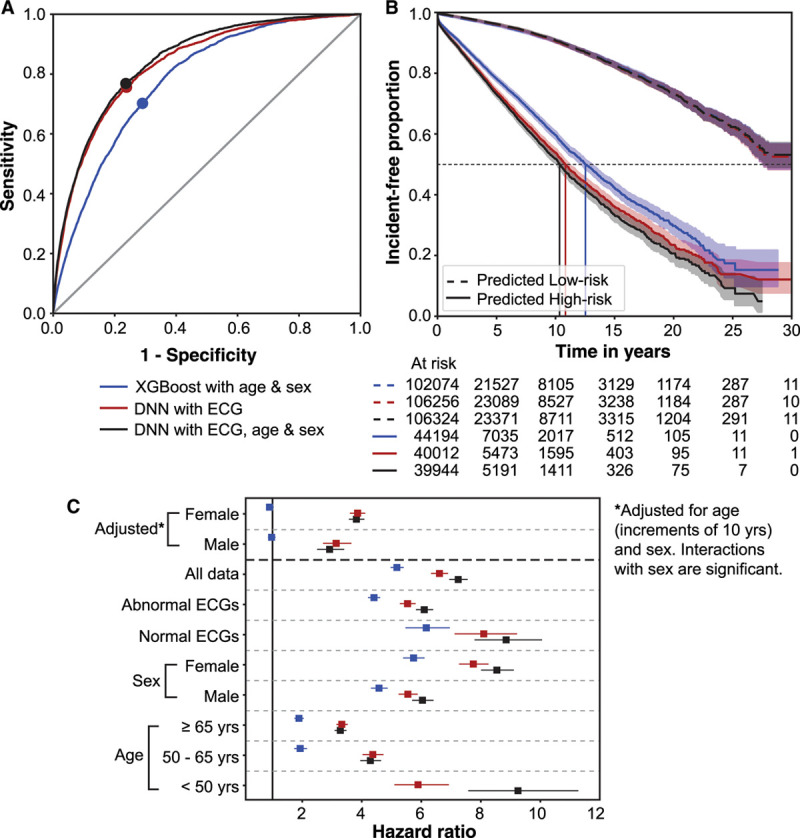
ROC curves, incidence-free KM survival curves, and HRs in subpopulations for the 3 models evaluated on the holdout set. The 3 models are XGBoost model with age and sex only (blue); DNN model with ECG traces only (DNN-ECG; red); and DNN model with ECG traces, age, and sex (DNN-ECG-AS; black) for all ECGs in the holdout set. A, ROC curves with operating points marked for the 3 models. B, Incidence-free KM curves for the high- and low-risk groups for the operating point shown in A for a follow-up of 30 years. Note that curves corresponding to the low-risk group for all 3 models overlap. C, The plot of HR with 95% CIs for the 3 models in subpopulations defined by age groups, sex, and normal or abnormal ECG label. Note that there is no HR for age <50 years for the first model as there was no subject classified as high-risk for new-onset atrial fibrillation by the model for that subpopulation. DNN indicates deep neural network; HR, hazard ratio; KM, Kaplan-Meier; and ROC, receiver operating characteristic.