
Figure 4.
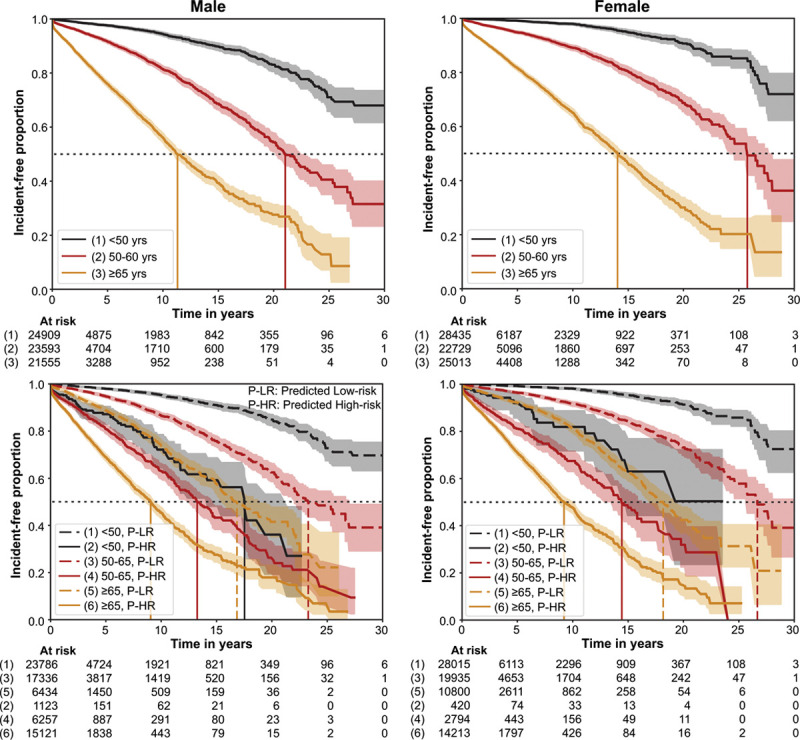
Incidence-free KM survival curves within the holdout set for subpopulations defined by sex, and age groups. The top row shows the KM curves for subpopulations in age groups: <50 years, 50 to 65 years, and ≥65 years for men (left) and women (right). The bottom row shows the KM curves for the model-predicted (model M0 trained with ECG traces, age, and sex; DNN-ECG-AS) low-risk groups and high-risk groups for new-onset atrial fibrillation for each age group for men and women. It also reflects relative hazards between age groups. The horizontal dotted gray line represents incidence-free proportion of 50%, and vertical lines represent the median survival time for the respective curves. DNN indicates deep neural network; and KM, Kaplan-Meier.