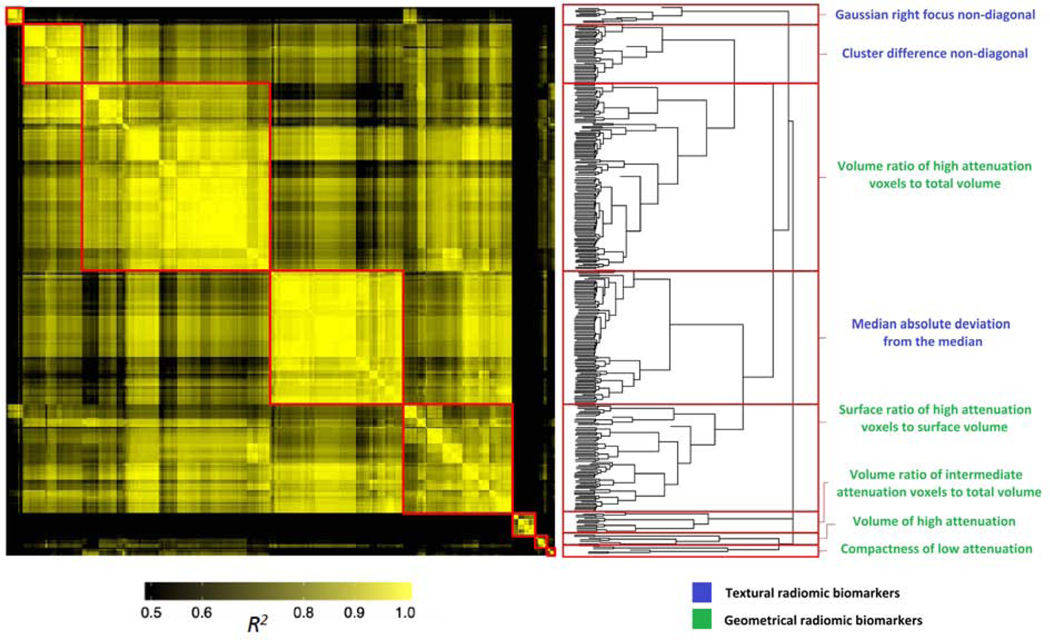
Figure 3: Heatmap and clustering dendrogram of significant radiomic parameters.
Heatmap of R2 values on linear regression analysis between the 362 radiomic features that were significant among the 3 cohorts. R2 values were plotted against each other and ordered to show the statistically different information clusters present in the dataset (red boxes). The color-coding indicates the value of explained variance: R2 values <0.5 are black, whereas greater values are shown in yellow with increasing intensity. The resulting hierarchical clustering dendrogram, partitioned into the 8 clusters (red boxes), is shown on the right. The radiomic biomarker from each cluster with the smallest p-value is displayed.

