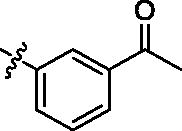
Table 2.
In vitro cell-based assay results of 9–20.

| Compound | R1 | R2 | Recovery of ΔΨm (%) | ATP Recovery (%) | MTT |
ROS Inhibition (%) | |
|---|---|---|---|---|---|---|---|
| Recovery (%) | Viability (%) | ||||||
| 7 (VH034) | 78% | 42% | 28% | 95% | 97% | ||
| 9 (VH057) | OMe | Me | 30% | ND | ND | ND | ND |
| 10 (VH058) | OEt | Me | 52% | 49% | 45% | 87% | −177% |
| 11 (VH059) | OEt | i-Bu | 59% | ND | ND | ND | −234% |
| 12 (VH060) | OEt | n-Bu | 1% | ND | ND | ND | ND |
| 13 (VH061) | OMe |  |
66% | 14% | ND | ND | ND |
| 14 (VH062) | OMe |  |
77% | 122% | 92% | 120% | 136% |
| 15 (VH063) | OEt |  |
86% | 31% | 59% | 139% | −4% |
| 16 (VH064) | OMe |  |
74% | 38% | 32% | 135% | 112% |
| 17 (VH065) |  |
 |
72% | −105% | ND | ND | ND |
| 18 (VH066) |  |
 |
53% | −18% | ND | ND | ND |
| 19 (VH067) |  |
 |
73% | −77% | ND | ND | ND |
| 20 (VH068) |  |
 |
50% | −55% | ND | ND | ND |
| Piracetam | 60% | 127% | 29% | 132% | 129% | ||
| CsA | 55% | −46% | 61% | 90% | NDa | ||
ND: Not determined.
