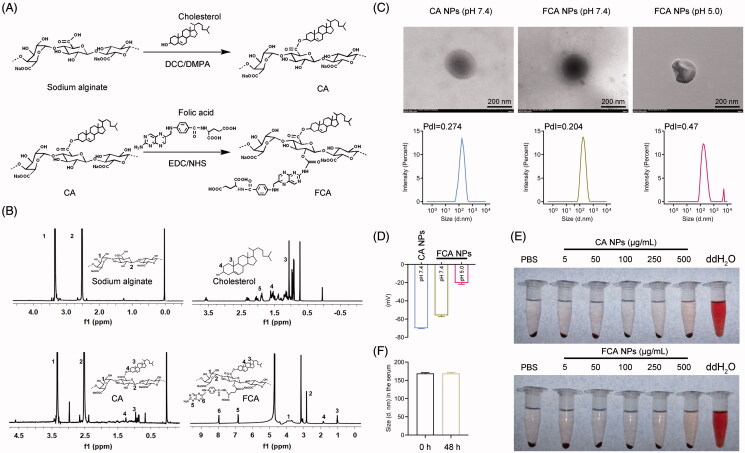
Figure 1.
Preparation and characterization of the FCA NPs. (A) Schematic illustration of the formulation of FCA. (B) 1H NMR spectra of FCA. (C) Representative TEM images of the CA NPs, FCA NPs (pH 5.0) and FCA NPs (pH 7.4) (scale bars: 200 nm). Size distributions of the CA NPs, FCA NPs (pH 5.0) and FCA NPs (pH 7.4) measured using a Mastersizer Micro. (D) Zeta-potentials of the CA NPs, FCA NPs (pH 5.0) and FCA NPs (pH 7.4). (E) Intuitive images of the hemolysis assay. (F) Stability of the FCA NPs in the serum at indicated times, n = 3 for each group. All values are presented as the mean ± SD.

