
Figure 27.
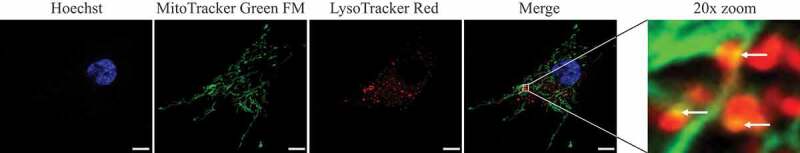
Human fibroblasts showing colocalization of mitochondria with lysosomes. The degree of colocalization of mitochondria with lysosomes in human fibroblasts was measured via live cell imaging microscopy at 37°C and 5% CO2 atmosphere using the ApoTome® technique. LysoTracker® Red DND-99 staining was applied to mark lysosomal structures (red), and MitoTracker® Green FM to visualize mitochondria (green). Hoechst 33342 dye was used to stain nuclei (blue). A positive colocalization is indicated by yellow signals (Merge) due to the overlap of LysoTracker® Red and MitoTracker® Green staining (white arrows). Scale bar: 10 μm. Statistical evaluation is performed by calculating the Pearson’s coefficient for colocalizing pixels. Image provided by L. Burbulla and R. Krüger