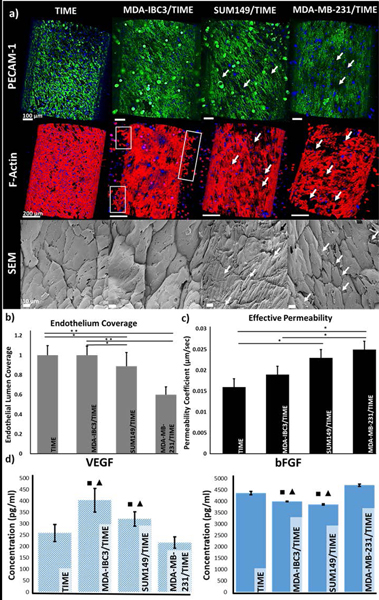
Fig. 3.
Characterization of the in vitro vascularized microfluidic platforms upon completion of the graded flow protocol. (a) Endothelial morphology and adhesion observed through PECAM-1 and DAPI (top row, scale bar: 100 μm), and F-actin and DAPI (middle row, scale bar: 200 μm) immunofluorescent staining, and SEM analysis of the endothelium (bottom, scale bar: 10 μm). PECAM-1 (green) staining revealed difference in endothelial cell-cell junctions between neighboring TIME cells, F-actin (red) staining and SEM images revealed morphological difference in the endothelium. White arrows denote gaps between the neighboring cells and the boxed areas in the F-actin images show early signs of angiogenic sprouting. (b) Quantification of endothelium coverage of the vessel lumen from F-actin stained images revealed a decrease in coverage in the MDA-MB-231 and SUM149 platforms; *p<0.05, ** p< 0.01. (c) Measured effective permeability of 70 kDa green fluorescent dextran perfusion through the platforms showed a significant decrease in vessel permeability in the MDA-MB-231 and SUM149 platforms; *p<0.05. (d) VEGF and bFGF expression measured by ELISA showed significantly higher VEGF expression in the IBC platforms while bFGF was higher in the non-IBC and acellular control platforms; ■, ▲denote significance (p<0.05) compared to acellular TIME control and MDA-MB-231 platforms, respectively.

