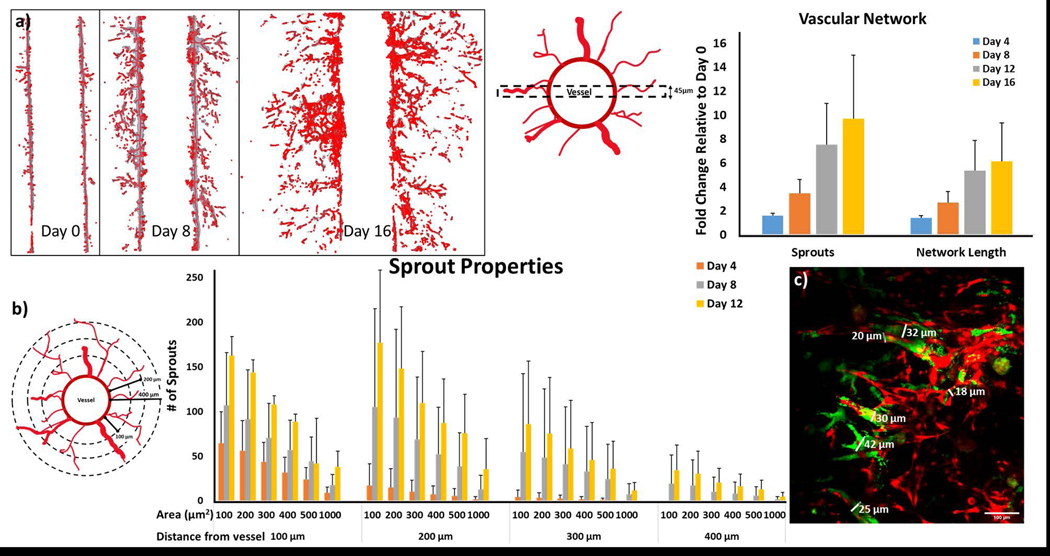
Fig. 8.
Analysis of the vascular network. (a) A 45 μm region of interest at the center of the vascular vessel was used to quantify the number of sprouts and the network length. (b) Representative images of the vascular network in the region of interest derived by applying the algorithm developed by Kollmannsberger et al. and Crosby et al. (Crosby et al., 2019; Kerschnitzki et al., 2013; Kollmannsberger et al., 2017) used for determining (c) fold change comparisons of total network length and number of sprouts normalized to the Day 0 values. Results show a steady increase in both number of sprouts and total vascular network length at each subsequent time point. (d) A schematic cross-section of the vessel with vascular sprouting used for calculation of number of sprouts with cross sectional areas ranging from 100 to 1000 μm2 determined at 100, 200, 300 and 400 μm away from the vascular vessel. (e) Number of sprouts present at 100, 200, 300, and 400 μm away from the vessel as well as the cross sectional areas of those sprouts were determined. Over time, the new sprouts increase in both cross sectional area, an indication of lumen formation, and length. (f) Measurement of the diameters of the in vitro sprouts with lumen capable of particle perfusion (vessels with green signal from microspheres overlaying red signal from endothelial sprouts) taken on Day 12. Sprout areas range from 15–42 μm (scale bar indicates 100 μm) and correlate with the increase in larger area sprouts found at later time points in Fig. 8e.

