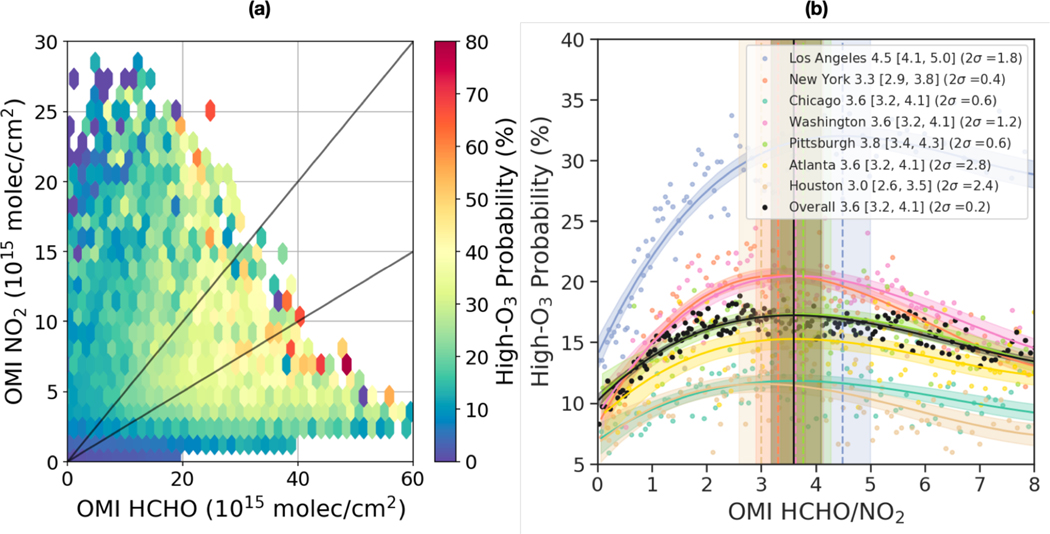
Figure 1.
(a) Probability of O3 exceeding 70 ppbv (high-O3 probability) as a function of OMI ΩNO2 and ΩHCHO. All ground-based hourly O3 observations (averaged at 1 PM and 2 PM local time) in the warm season (May to October) from 2005 to 2016 are first aggregated based on corresponding daily OMI ΩNO2 and ΩHCHO (interval: 0.5 ´ 1015 molecules/cm2). We only include sites over polluted regions (defined as long-term average OMI ΩNO2 > 1.5×10¹⁵ molecules/cm2). The probability is the number of observations with O3 higher than 70 ppbv divided by the total number of observations at given OMI ΩNO2 and ΩHCHO. The black lines delineate OMI HCHO/NO2 values of 2 and 4. (b) Probability of O3 exceeding 70 ppbv as a function of OMI HCHO/NO2 for all selected sites (black) and seven cities individually. High-O3 probability is calculated by first matching hourly O3 observations with daily OMI HCHO/NO2, dividing these paired observations to 100 (200 for black dots) bins based on OMI HCHO/NO2, and then calculating the high-O3 probability (y axis) for each OMI HCHO/NO2 bin (x axis, labeled as a dot). The solid lines are fitted third order polynomial curves, and the shading indicates 95% confidence intervals. The vertical lines indicate the maximum of the fitted curve (labeled in the legend), and the vertical shading represents the range over the top 10% of the fitted curve (regime transition). The uncertainty is two standard deviation (2σ or 95% confidence interval) of the derived peaks using statistical bootstrapping by iteratively running the model on 50 randomly selected subsets of 30 data pairs.

