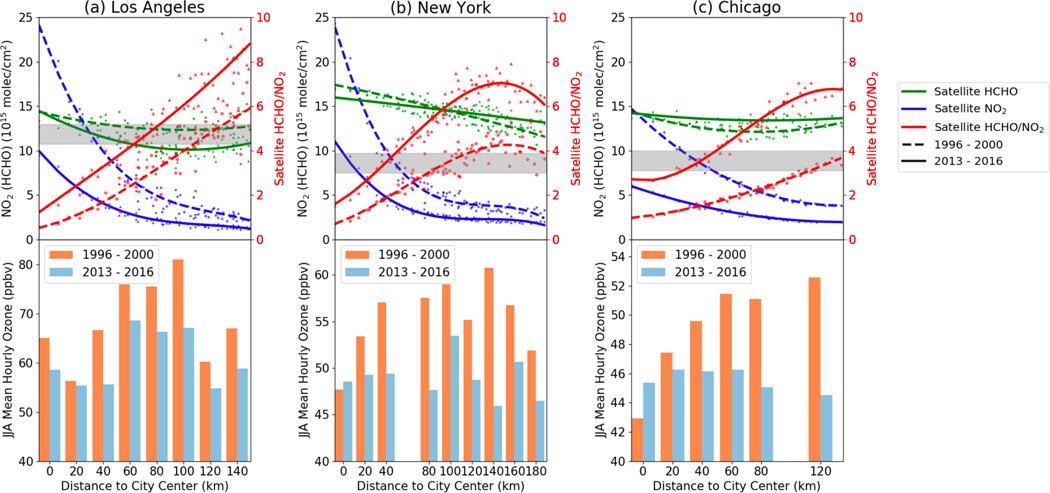
Figure 3.
Satellite-based summertime ΩNO2 (blue dots), ΩHCHO (green dots), HCHO/NO2 (red dots) and summertime average O3 (bars) as a function of distance to the city center during 1996 – 2000 and 2013 – 2016 for three cities: (a) Los Angeles, (b) New York, and (c) Chicago. City center is defined as the grid cell with highest summertime ΩNO2 within this region (labeled as red stars in Figure 2), which we find do not change over time in these cities (Figures 2 and S11). The curves shown in the top row are a polynomial fit (third order for ΩNO2 and HCHO/NO2, second order for ΩHCHO) curves. The gray area indicates the regime transitions for HCHO/NO2, which is derived for each city individually as shown in Figure 1b. Summertime average O3 is calculated from hourly AQS observations at OMI overpass time (averaged at 1 PM and 2 PM local time). AQS O3 sites are grouped by distance to the city center at 20 km intervals.

