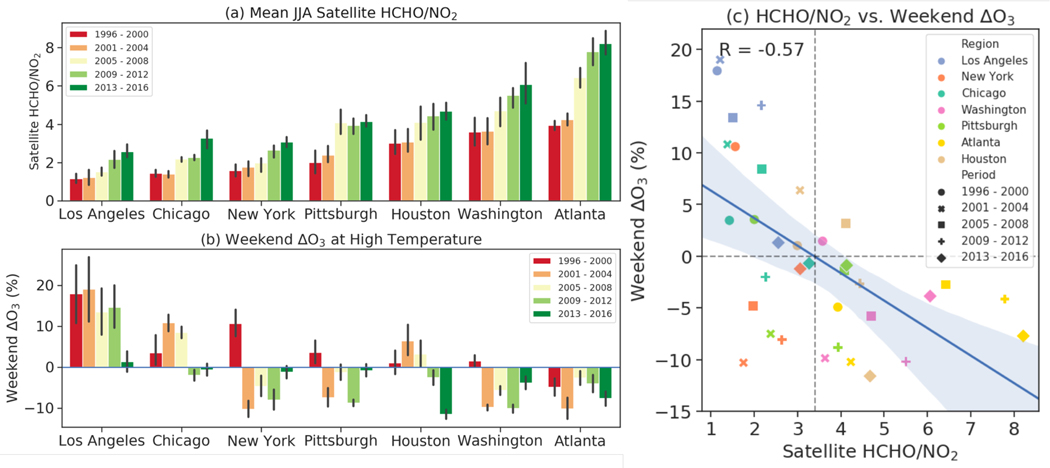
Figure 4.
(a) Satellite-based summertime average HCHO/NO2 in seven cities during five periods. (b)Weekday-to-weekend difference in average 1–2 pm summertime O3 (weekend ΔO3, mean O3 Saturday-Sunday minus mean O3 Tuesday-Friday) within each city at: (b) high temperature (> median summer average temperature 1–2 pm) observed at AQS sites during five periods. Satellite-based HCHO/NO2 is sampled over ground-based AQS O3 sites. The error bars represent year-to-year variability in a given period. (c) Scatter plot between summertime average satellite-based HCHO/NO2 and the weekend ΔO3 with colors representing different cities and symbols representing different periods. The blue line is the fitted linear regression line with the 95% confidence interval shaded.

