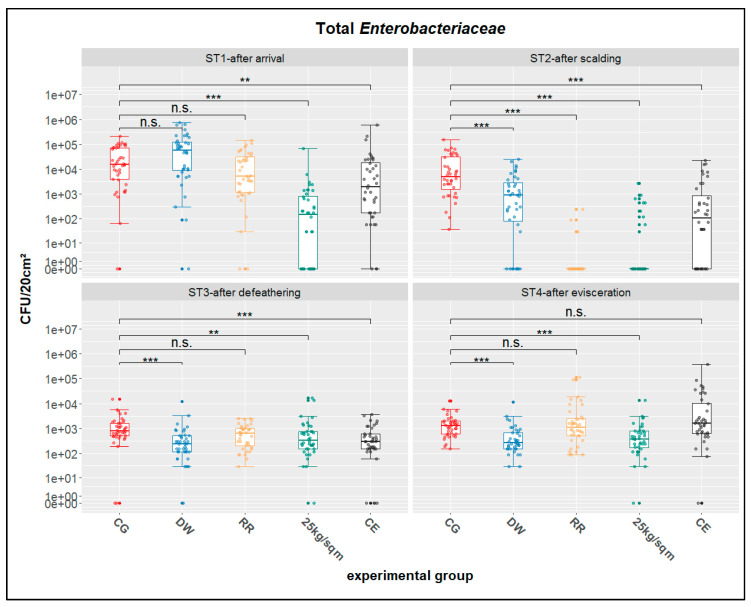
Figure 2.
Distributions and statistics for total Enterobacteriaceae; ST1-after arrival, ST2-after scalding, ST3-after defeathering, ST4-after evisceration; CG-control group, DW-drinking water supplement, RR-slow growing breed Rowan × Ranger, 25 kg/sqm-reduced stocking density, CE-competitive exclusion; results of nonparametric multiple contrast test are shown as: n.s.—not significant, **—p < 0.01, ***—p < 0.001. The lower and upper hinges of the boxes correspond to the first and third quartiles (the 25th and 75th percentiles). The line in the box between lower and upper hinge corresponds to the median. The upper whisker extends from the upper hinge to the largest value but no further than 1.5 × IQR from the hinge (where IQR is the inter-quartile range, or distance between the first and third quartiles). The lower whisker extends from the lower hinge to the smallest value but at most 1.5 × IQR of the hinge.

