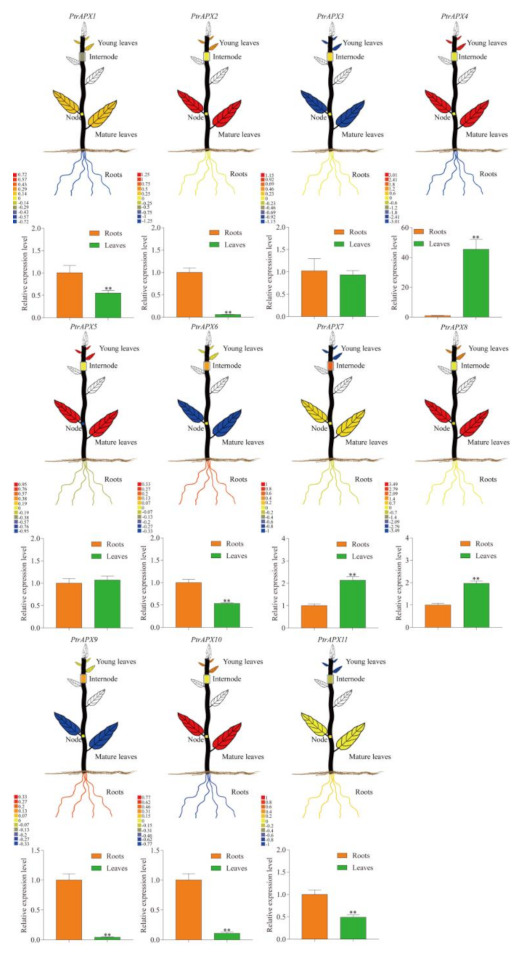
Figure 7.

Tissue-specific expression profiles of PtrAPX genes. The visual image for each PtrAPX gene in P. trichocarpa was obtained from PopGenIE [43]. Error bars represent the standard deviations from three biological replicates. Asterisks indicate stress treatment groups that showed a significant difference in transcript abundance compared with the control group (** p < 0.01).
