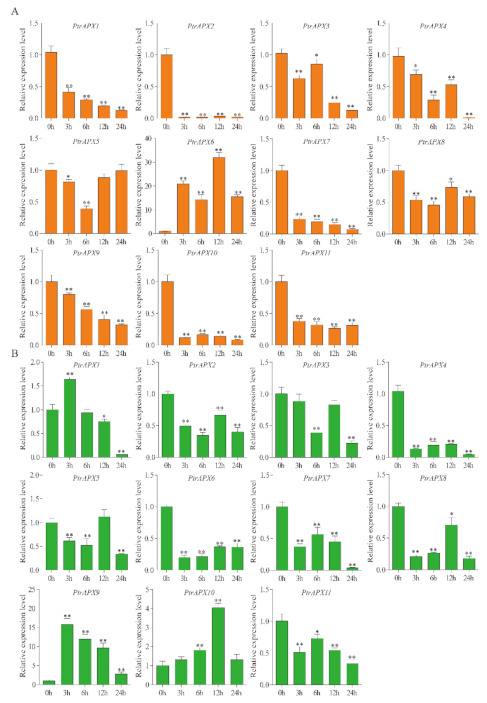
Figure 11.

Relative expression level of PtrAPX genes under 10 mM (NH4)2SO4 treatment estimated by RT-qPCR. The expression pattern of PtrAPX genes in roots (A) and leaves (B) is shown. Error bars represent the standard deviations from three biological replicates. The x-axis represents time points after (NH4)2SO4 treatment. Asterisks indicate stress treatment groups that showed a significant difference in transcript abundance compared with the control group (* 0.01< p < 0.05, ** p < 0.01).
