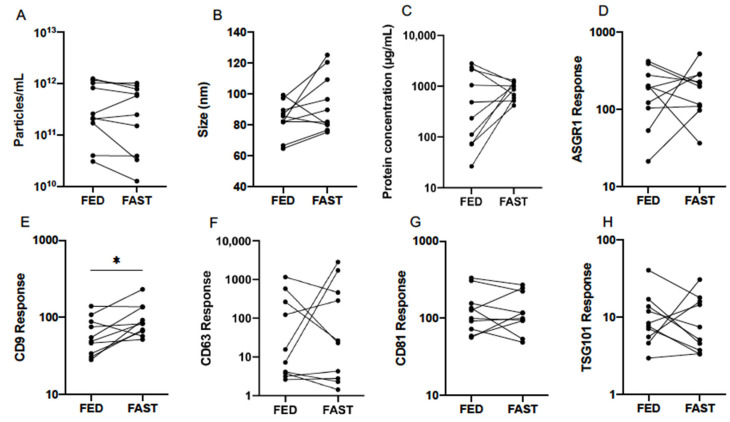
Figure 4.
Effect of fed and fasted state on serum EV particle abundance (A), size (B), total protein concentration (C), and expression of EV-associated protein markers (D–H), quantified by nanoparticle tracking analysis (NTA), microBCA assay, and liquid chromatography mass spectrometry (LCMS) from healthy volunteers (n = 10). Statistical analysis performed using paired t-tests. * p ≤ 0.05.

