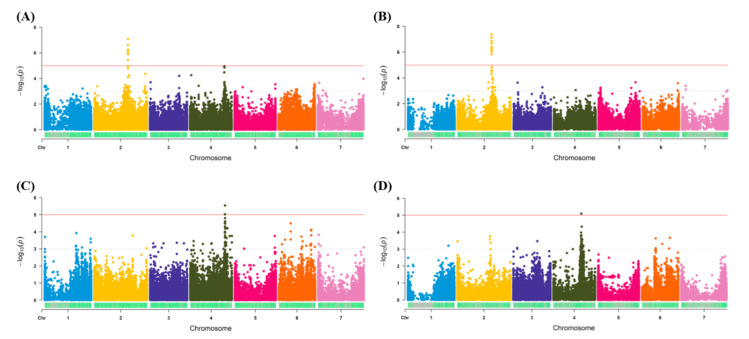
Figure 2.
Marker-trait association results for salt tolerance traits. (A) and (B) represent the plots generated for traditional phenotypic scores. (C) and (D) represent the plots generated for phenomics screen green color pixels. Plots A and C were generated from the data obtained from tGBS method, while B and D were from GBS-t method. The red line indicated the significant threshold level.

