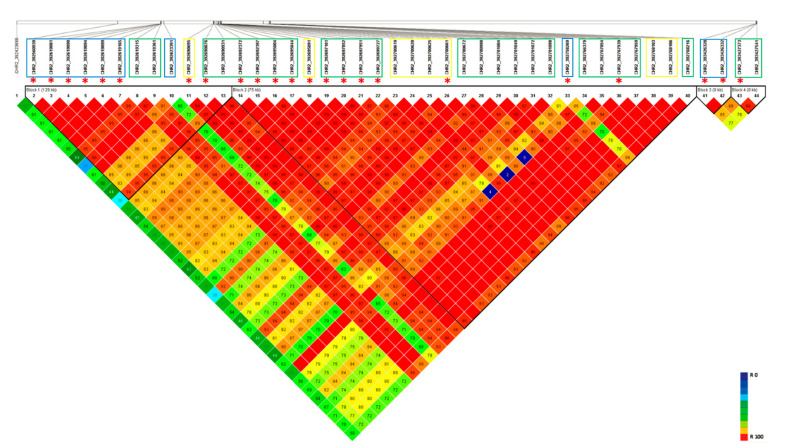
Figure 3.
LD heatmap on Chromosome 2 haplotypic region using SNP markers generated from both GBS methods. Markers derived from each GBS method was highlighted using the colored box. Blue: markers from tGBS method; Green: markers from GBS-t method; and Yellow: markers common to both GBS methods. ‘*’ represents the significant marker positions identified in the current study.

