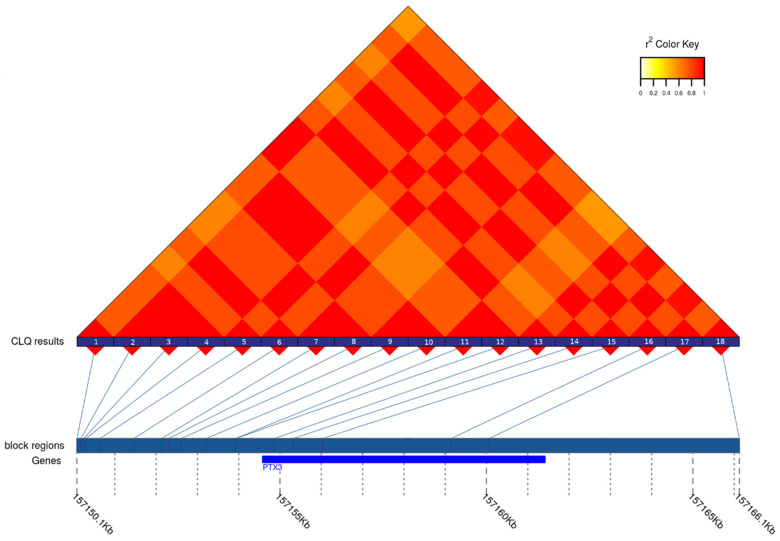
Figure 3.
The heatmap of LD between the SNPs in the region of PTX3 gene in the CEU population. The numbers at the bottom of LD plot designate the SNPs included in analyses. Their coordinates as well as the boundaries of the gene are presented at the line below LD plot. The SNPs with numbers 2, 3, 4, 6, 9, 10, 13, 15, and 17 are the members of the first group of strongly associated (r2 ≥ 0.8) SNPs, while the SNPs with the numbers 5,7,8,14,16,18 and 1,11,12 represent the second and the third group, respectively.

