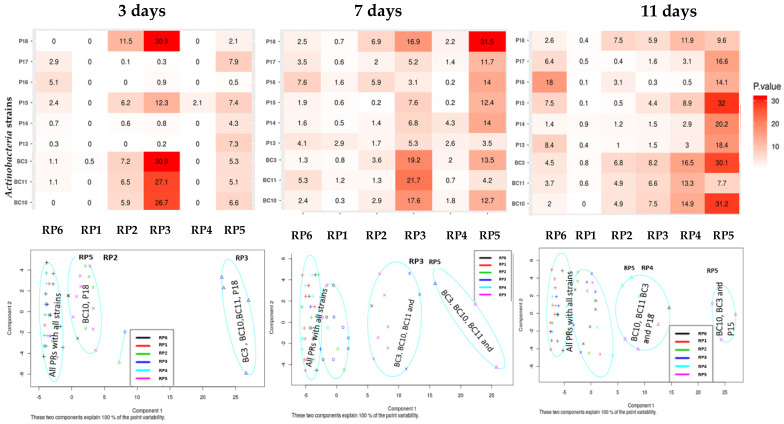
Figure 1.
Heatmap and PCA of Actinobacteria strains solubilization as a function of different grade of RP after 3, 7, and 11 days of incubation (T1, T2, and T3). The values represent mean (n = 3) corresponding to the RP solubilization activity. As shown in the color scale, red indicates a high RP solubilization. The signs x, o, + and Δ in the ellipses correspond to solubilization rates.

