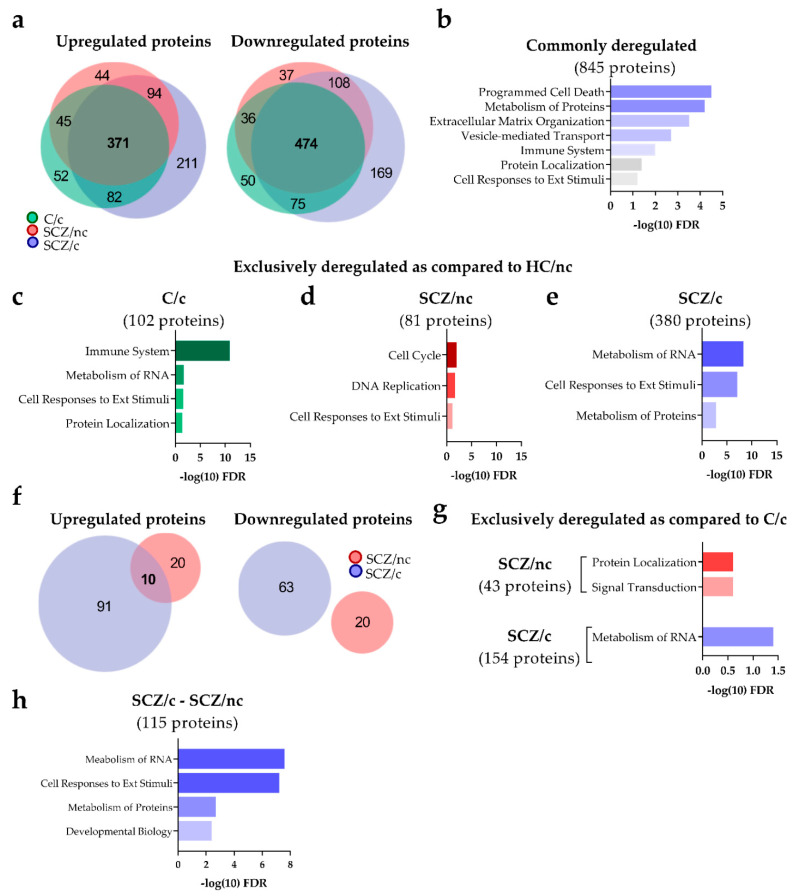
Figure 1.
Characterization of the proteome of ON cells from control subjects non-cannabis users (C/nc), control cannabis users (C/c), schizophrenia patients non-cannabis users (SCZ/nc) and schizophrenia patients cannabis users (SCZ/c). (a) Proteomic alterations in C/c, SCZ/nc and SCZ/c as compared to C/nc. The upregulated and downregulated proteins in C/c-C/nc, SCZ/nc-C/nc and SCZ/c-C/nc are represented in two different Venn diagrams. (b) Enrichment pathway analysis of the 845 proteins commonly deregulated in C/c, SCZ/nc and SCZ/c as compared to C/nc. (c) Enrichment pathway analysis of the exclusively deregulated proteins in C/c, (d) SCZ/nc (e) and SCZ/c versus C/nc. (f) Proteomic alterations in SCZ/nc and SCZ/c as compared to C/c. The upregulated and downregulated proteins when SCZ/nc-C/c and SCZ/c-C/c are compared are represented in two Venn diagrams. (g) Functional characterization of the 43 proteins deregulated in SCZ/nc and the 154 proteins deregulated in SCZ/c as compared to C/c. (h) Functional characterization of the 115 proteins deregulated in SCZ/c as compared to SCZ/nc. Data from the pathway analysis are represented as minus the logarithm (10) of the FDR.

