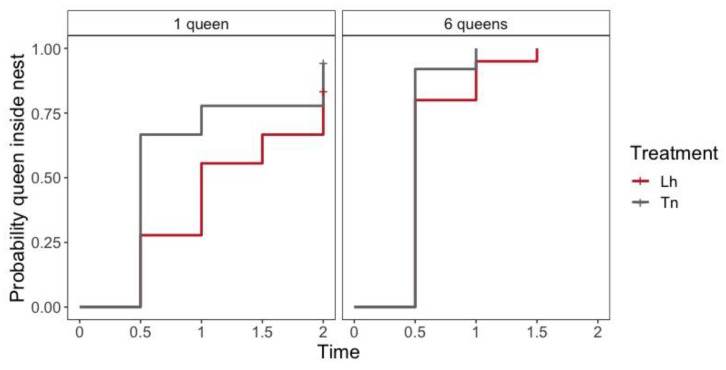
Figure 1.
Kaplan–Meier plot of time (in hours) for first queen to enter the nest shows the survivor function stratified according to the number of queens and species. Plus signs (+) indicate censored data and their corresponding x values for the time at which censoring occurred. Lh = L. humile nest and Tn = T. nigerrimum nest.

