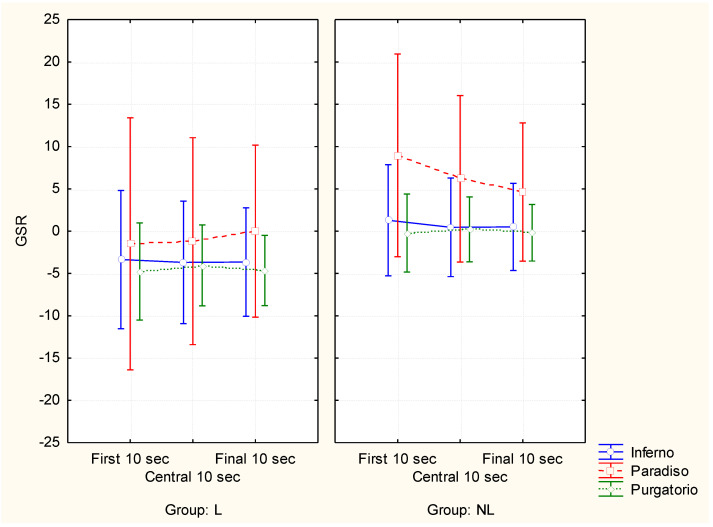
Figure 1.
Graph representing the significant interaction between the factors: CANTICA (Inferno, Paradiso and Purgatorio), TIME POINT (first, central and final 10 s segments) and GROUP (L: Literature students; NL: Non-Literature students) resulting from the ANOVA analysis for the Galvanic Skin Response (GSR) index. Vertical bars denote 0.95 confidence interval.

