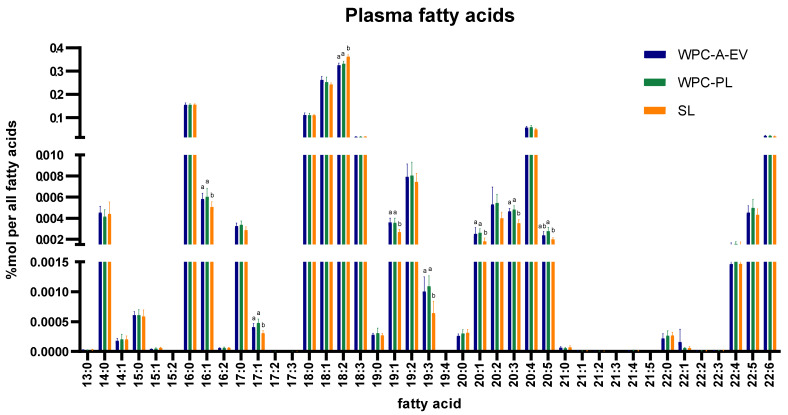
Figure 3.
Day 19 plasma fatty acid analysis in whey protein concentrate from acid whey enriched in extracellular vesicles (WPC-A-EV, blue, n = 7), whey protein concentrate enriched in phospholipids (WPC-PL, green, n = 7) and soy lecithin (SL, orange, n = 7) groups. Missing values: 19:4 (1 WPC-A-EV) and 21:3 (1 WPC-A-EV, 2 WPC-PL, 2 SL). Data are presented as mean ± sd. Different lower-case letters (a and b) indicate significant (p < 0.05) differences between WPC-A-EV, WPC-PL and SL groups for each individual fatty acid.

