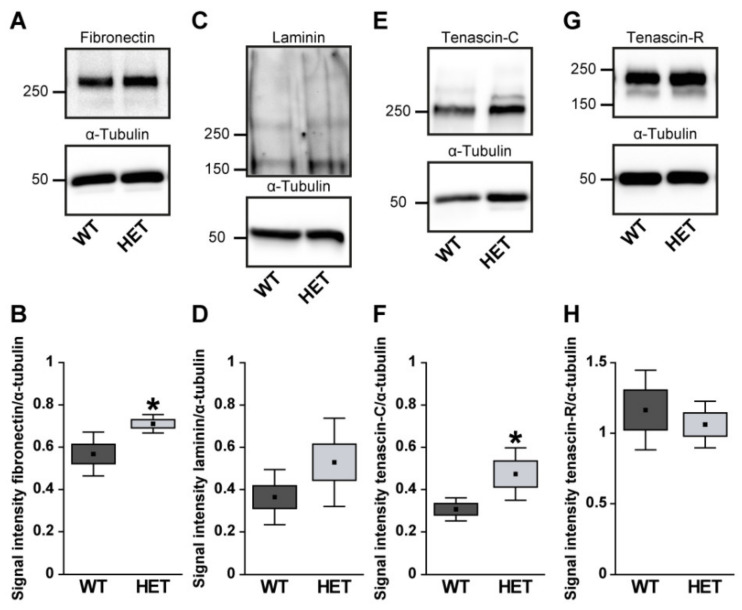
Figure 3.
Western blot analyses of glycoproteins of WT and HET retinal tissue. A significantly increased protein band intensity was observed for fibronectin (A,B) and tenascin-C (E,F) in glaucomatous HET mice. Relative protein quantification revealed a slightly enhanced band intensity of laminin (C,D) in the HET group. Comparable protein levels of tenascin-R were found in both genotypes (G,H). Groups were analyzed by Student‘s t-test. Data are shown as mean ± SEM ± SD. * p < 0.05. n = 4–6/group.

