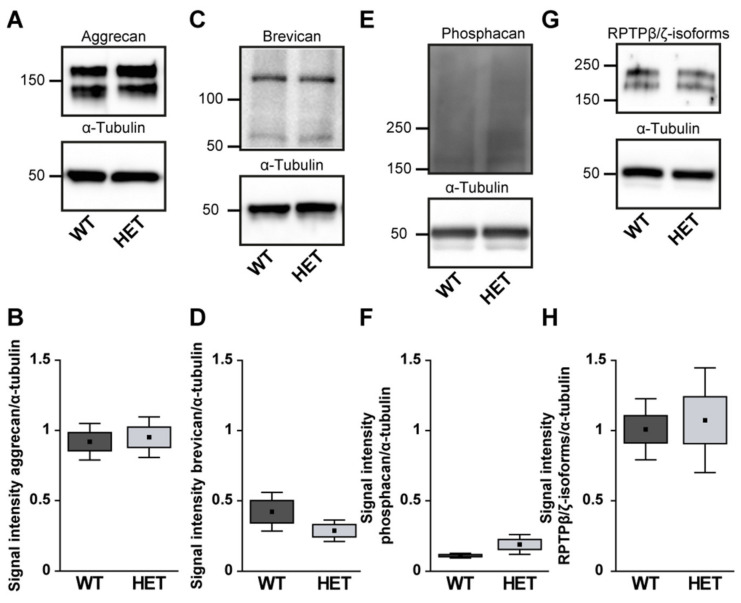
Figure 8.
Western blot analyses of relative aggrecan (A,B), brevican (C,D), phosphacan (E,F) and RPTPβ/ζ isoforms (G,H) in WT and HET retinae. Comparable total protein levels were seen for aggrecan, brevican and all RPTPβ/ζ isoforms. A slightly enhanced signal intensity was detected for phosphacan in the HET condition. Values are indicated as mean ± SEM ± SD. n = 4–5/group.

