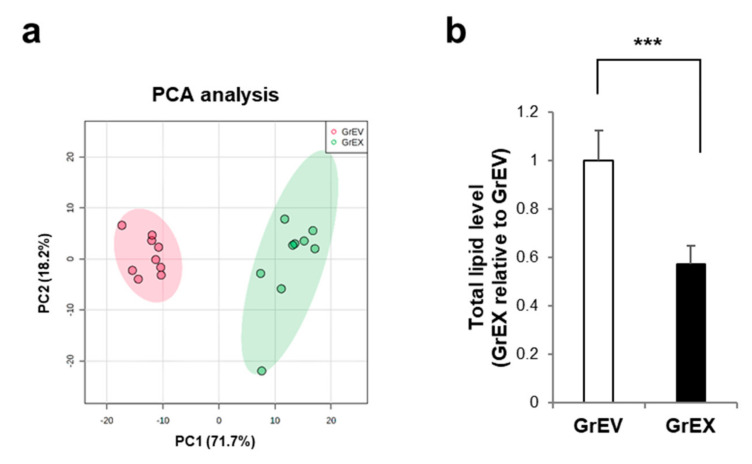
Figure 6.
The discriminative lipidomic profile of ginseng root-derived extracellular vesicles (GrEVs). (a) Principal component analysis (PCA) of lipidomic information was performed based on the mass spectrometry (MS) data of GrEVs and ginseng root extracts (GrEXs). Lipidomic data were analyzed statically using the package in MetaboAnalyst (n = 9 per group; three biological replicates, each with three technical replicates). X axis: principal component 1 (PC1). Y axis: principal component 2 (PC2). (b) Relative total lipid expression levels in both groups. The expression levels of total lipids were determined by summing the amounts of identified lipid species in GrEVs and ginseng root extracts (GrEXs), respectively. The value of fold change is shown as the means ± standard deviations (n = 9 per group; three biological replicates, each with three technical replicates). Statistical significance was analyzed by Student’s t-tests for two groups (*** p < 0.001).

