Figure 7.
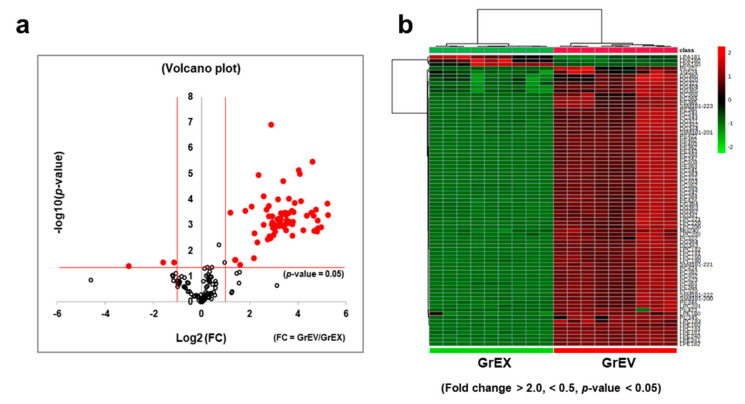
Differentially enriched lipid species and lipid composition and proportion in ginseng root-derived extracellular vesicles (GrEVs) versus ginseng root extracts (GrEXs). (a) The 188 identified lipids in GrEVs are represented in a volcano plot according to their statistical p-values and fold-changes when compared to those detected in GrEXs. The red lines at the left and the right sides represent distinct boundaries for lipid species with a <0.5-fold decrease or a >2.0-fold increase, respectively, in GrEVs (when compared to those in GrEXs. The horizontal red line represents the boundary for the significance (p < 0.05). (b) A heat map graphically represents the differential fold changes of 73 lipid species in GrEVs compared to the corresponding levels in GrEXs (fold change >2.0 or <0.5, p < 0.05). The relative differences are indicated by the color intensity, where red shading indicates increased levels and green shading indicates decreased levels.

