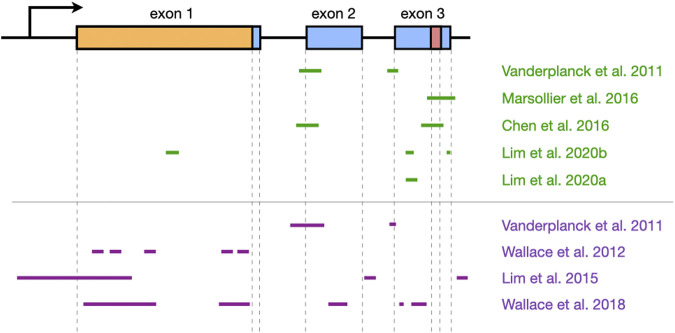
FIGURE 3.
Overview of DUX4 regions that have been targeted by oligonucleotide therapies. The structure of the DUX4 gene is shown at the top (arrow indicates promoter region; boxes, exons; lines, introns; orange, open reading frame; red, polyadenylation signal), and the regions that have been targeted by antisense oligonucleotides (green) or RNA interference (purple) are shown at the bottom. Approximate locations are shown, and the figure is not to scale. Note that Ansseau et al. (2017) used the same oligonucleotides as Vanderplanck et al. (2011). DUX4 structure was based on information from Ensembl, transcript ID ENST00000569241.5.

