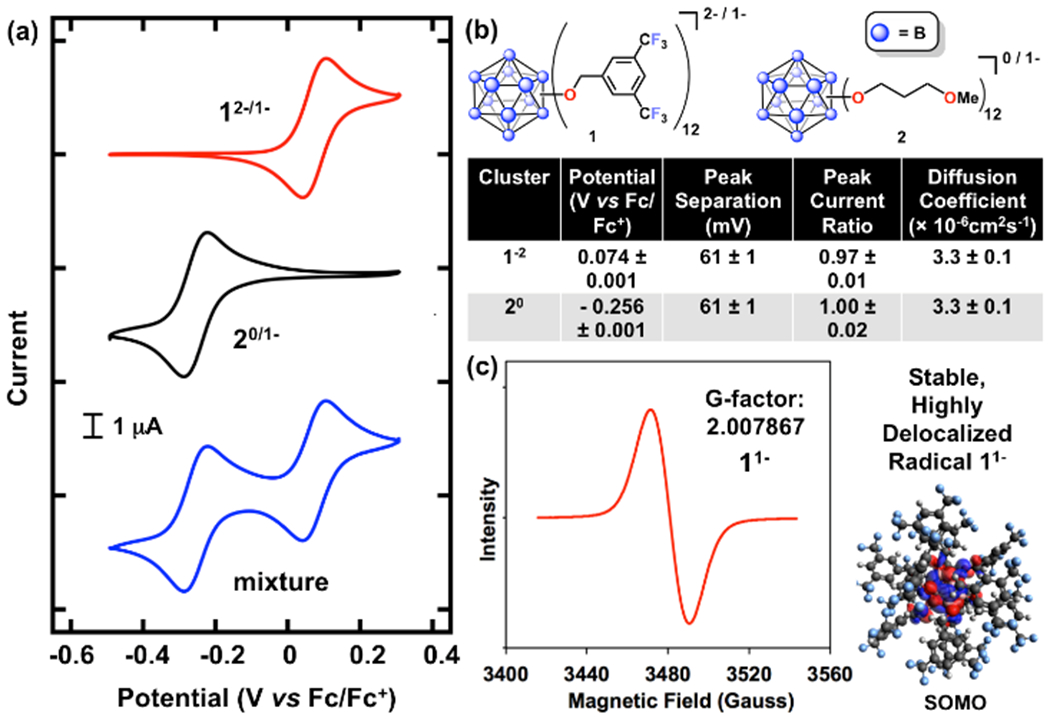
Figure 2.

(a) Cyclic voltammograms of 12−/1− (top, red), 20/1− (middle, black), and a mixture of the two clusters (bottom, blue) at 1 mM in 0.5 M TBAPF6 in MeCN at a scan rate of 10 mV s−1, referenced to ferrocene/ferrocenium at 0 V. (b) Measured electrochemical parameters for 12−/1− and 20/1− calculated at 10 mV s−1. (c) EPR spectrum and calculated SOMO energy state representation of 1−1.22
