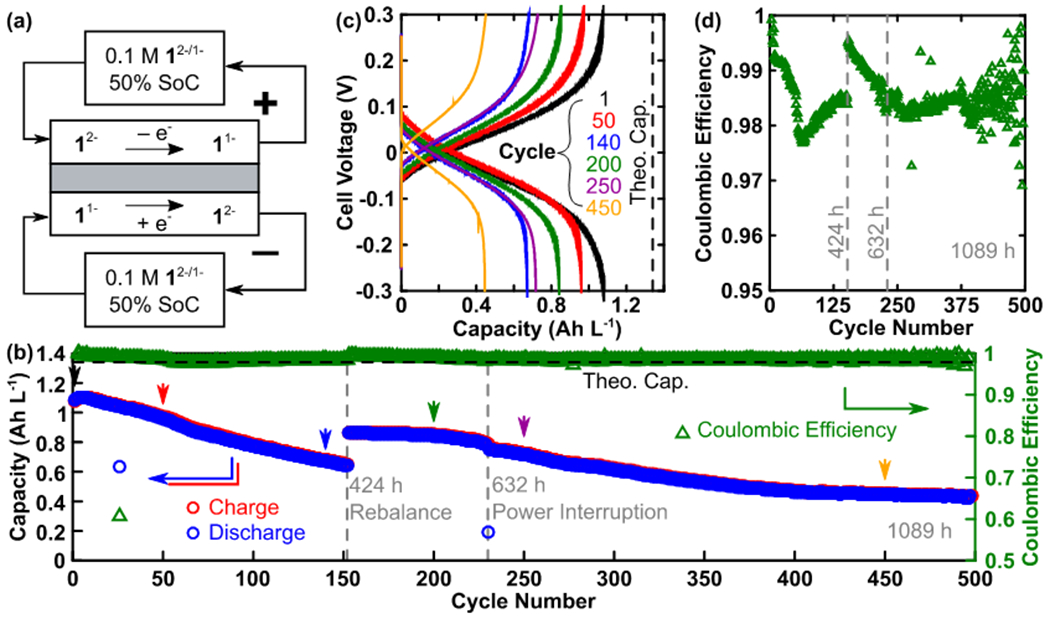
Figure 3.

Symmetric flow cell containing cluster 1. (a) Cell setup. (b) Charge and discharge capacity plotted (left) as a function of cycle number in along with coulombic efficiency (right). Arrowheads (colors match c) indicate cycles for which the voltage profile is shown in (c). (c) Charge and discharge voltage profiles are shown for select cycles. (d) Detailed view of coulombic efficiency as a function of cycle number. Gray dashed lines in (b) and (d) indicate interruptions of the experiment due to intentional electrolyte rebalancing (424 h) and a building power outage (632 h).
