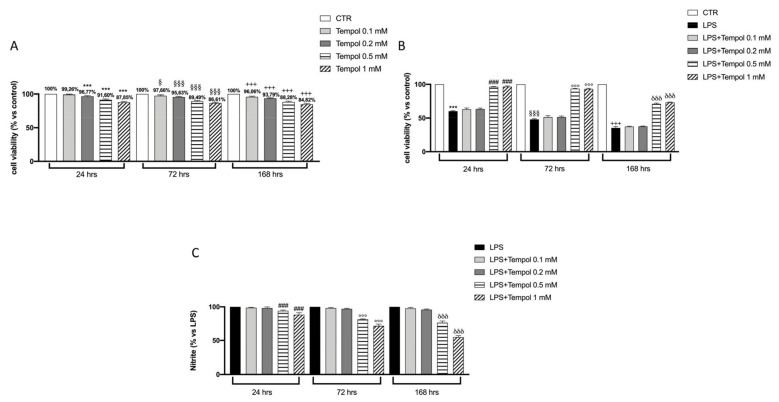
Figure 1.
Effects of tempol on J774 cell viability and nitric oxide production. MTT test performed on J774, without and with LPS stimulation, treated with tempol (0.1, 0.2, 0.5 and 1 mM) for 24, 72 and 168 h (A, B). Griess assay performed on the supernatant of LPS-stimulated J774 treated with different concentrations of tempol for 24, 72 and 168 h (C). Control (CTR), untreated J774 cells, LPS, J774 stimulated with LPS. Data are represented as the means ± SD of three independent experiments. One-way ANOVA test. § compare the LPS group 72 h to CTR group; *** p < 0.001 vs. CTR 24 h; §§§ p < 0.001 vs. CTR 72 h; +++ p < 0.001 vs. CTR 168 h; ### p < 0.001 vs. LPS 24 h; °°° p < 0.001 vs. LPS 72 h; δδδ p < 0.001 vs. LPS 168 h.

