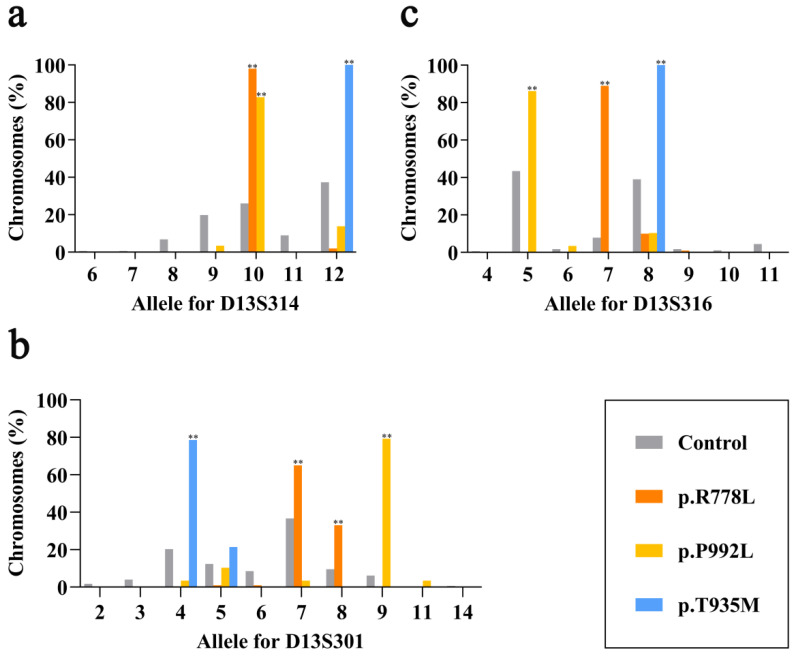
Figure 2.
(a–c) Allele distribution of p.R778L, p.P992L and p.T935M at each of the three microsatellite markers (D13S314, D13S301, D13S316) in Wilson’s disease (WD) patients from mainland China. Brown boxes indicate normal chromosomes as the controls. Orange boxes indicate chromosomes with p.R778L, yellow boxes indicate chromosomes with p.P992L, and blue boxes indicate chromosomes with p.T935M. Asterisks indicate the frequency of chromosomes with the corresponding variant was significantly higher than that of control chromosomes in the same allele group (** p < 0.01).

