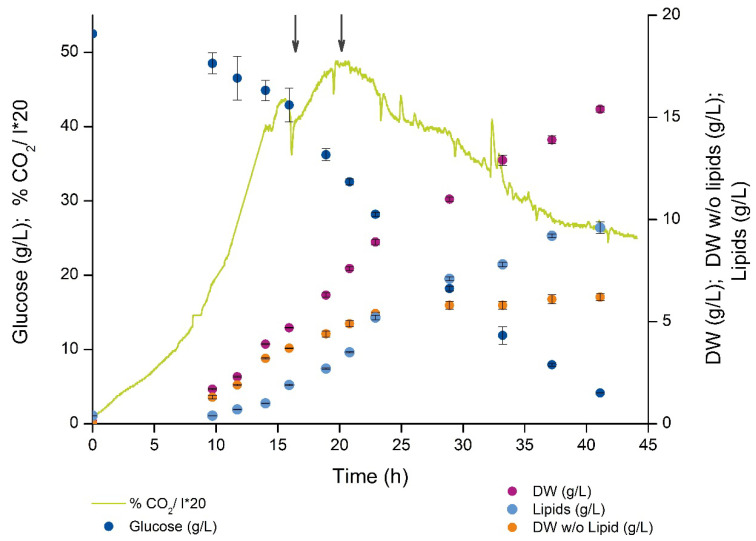
Figure 2.
Time-course profile for the nitrogen limited Aurantiochytrium sp. T66 bioreactor cultivation showing the continuous CO2 exhaust gas production (left y-axis, percentage in off-gas*20), glucose consumption (left y-axis, in g/L) and biomass formation (with and without intracellular lipids), and total lipid (TL) formation (biomass and lipid concentration in grams/L on the right y-axis). The two arrows indicate metabolic events discussed in the text. One representative biological replica is shown, error bars indicate standard deviation of at least three resamplings.

