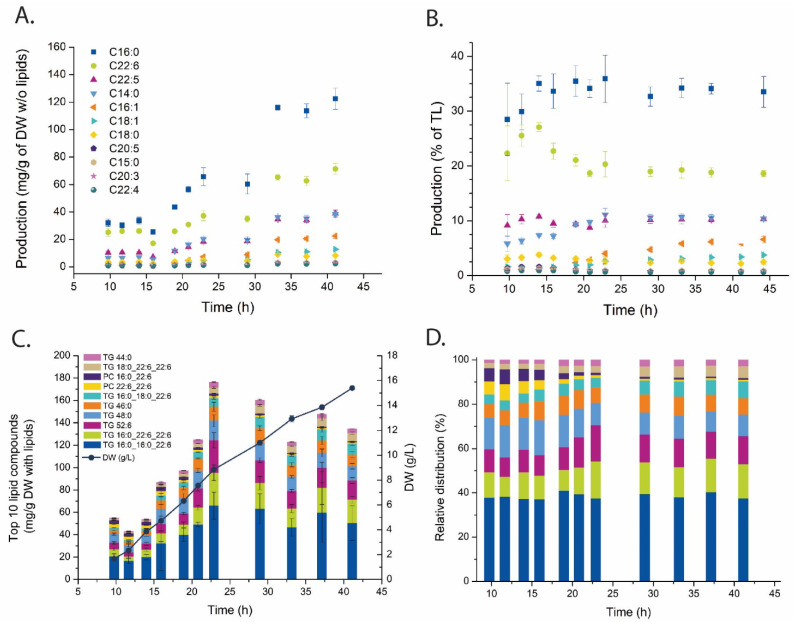
Figure 3.
Fatty acid and lipid time series profiling. (A,B) Concentration profile and relative distribution of fatty acids, and (C,D) the 10 most abundant lipid species. (A and B), (C and D) share same legends, respectively. TG—triglycerides, PC—phosphatidylcholines. Tabulated data and full identities can be found in Supplementary Tables S2 and S3.

