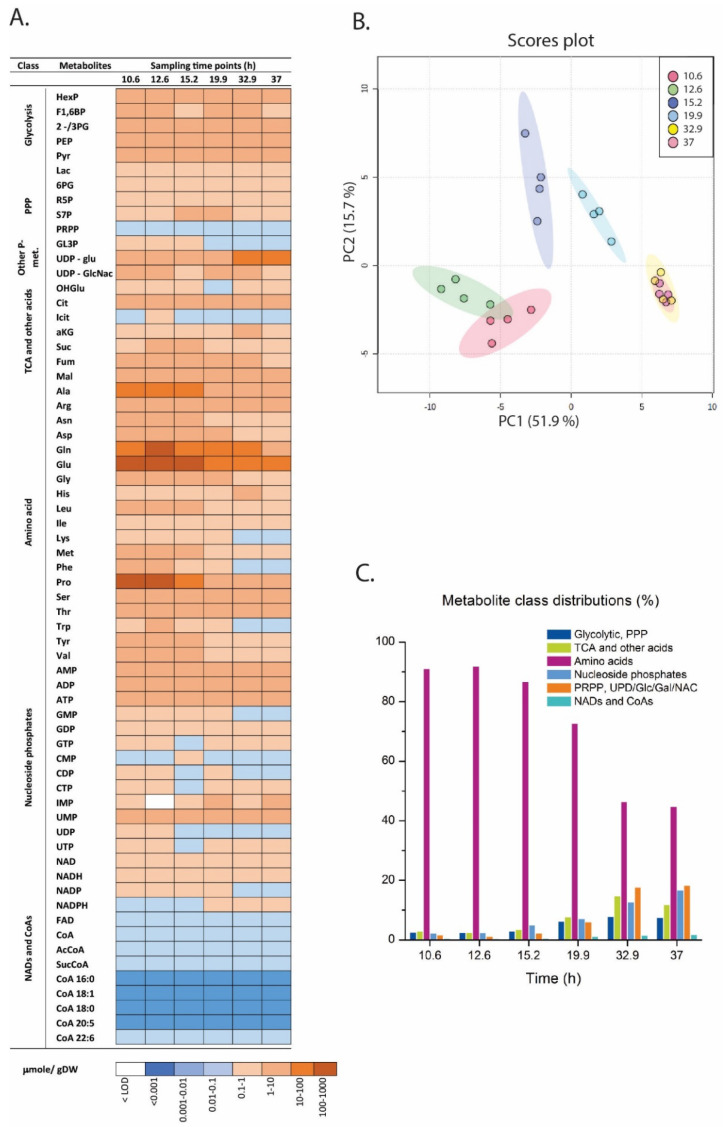
Figure 4.
Intracellular metabolite profiling using the six MS based methods for six sampling points (10.6 and 12.6 h—growth phase; 15.2 and 19.9 h—transition phase; 32.9 and 37.0—lipid accumulation (LA) phase). (A) Absolute concentrations in µmol/g DW of all quantified metabolites. Average of four technical replicas from one representative biological replica (i.e., cultivation) is presented. Long chain CoAs were obtained from a separate cultivation and are aligned along the time axis for incorporation in the same plot (bar plot of the same data set is presented in Supplementary Figure S1). (B) Principal component analysis of the metabolome time series with six sampling points. The score plot displays analysis without normalization but autoscaled. (C) Relative metabolite class distributions during the cultivation.

