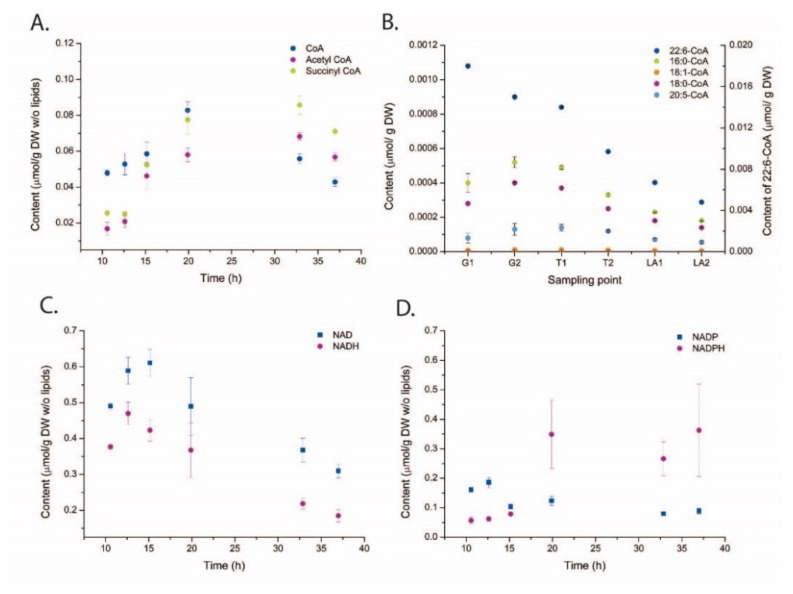
Figure 5.
Time series absolute concentrations in µmol/g DW units of SC-CoAs (A), LC-CoAs (B), NAD (H) (C), and NADP(H) (D). Metabolites are presented. The data are presented with averaged and standard deviation among four technical replicas. LC-CoA samples are from another biological replica and the samples are aligned to cultivation phases along the time axis (G—growth; T—transition; LA—lipid accumulation).

