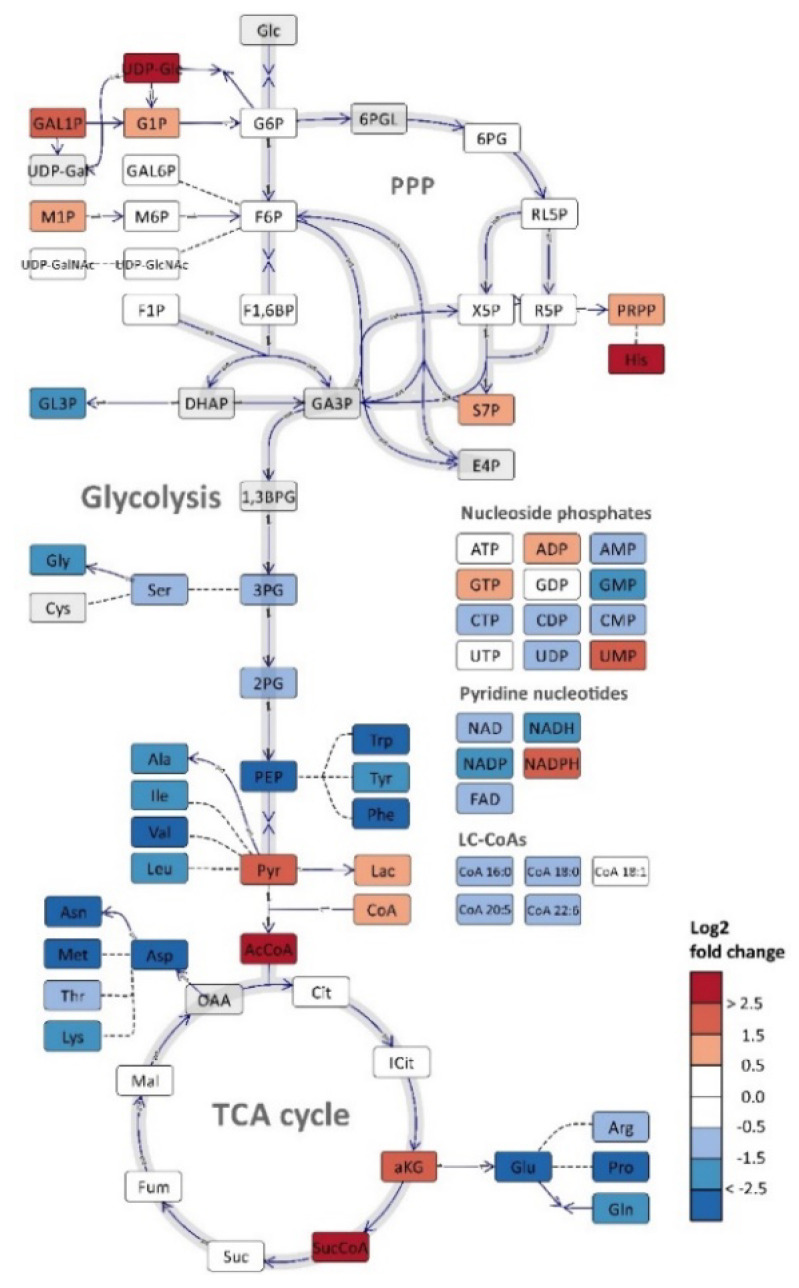
Figure 6.
Log2 ratio of metabolome data of sampling points 32.9 (LA phase) and 12.6 (growth phase) from the Aurantiochytrium sp. T66 cultivation. The figure was prepared using Omix visualization software [38], and data normalized to free available intracellular volume was used. Compartmentalization of eukaryotic cells is not included. Reactions with two opposite arrows indicate reversible reactions with different enzymes, bidirectional arrows are reversible reactions, dashed lines indicate that intermediates are not included.

