Figure 5.
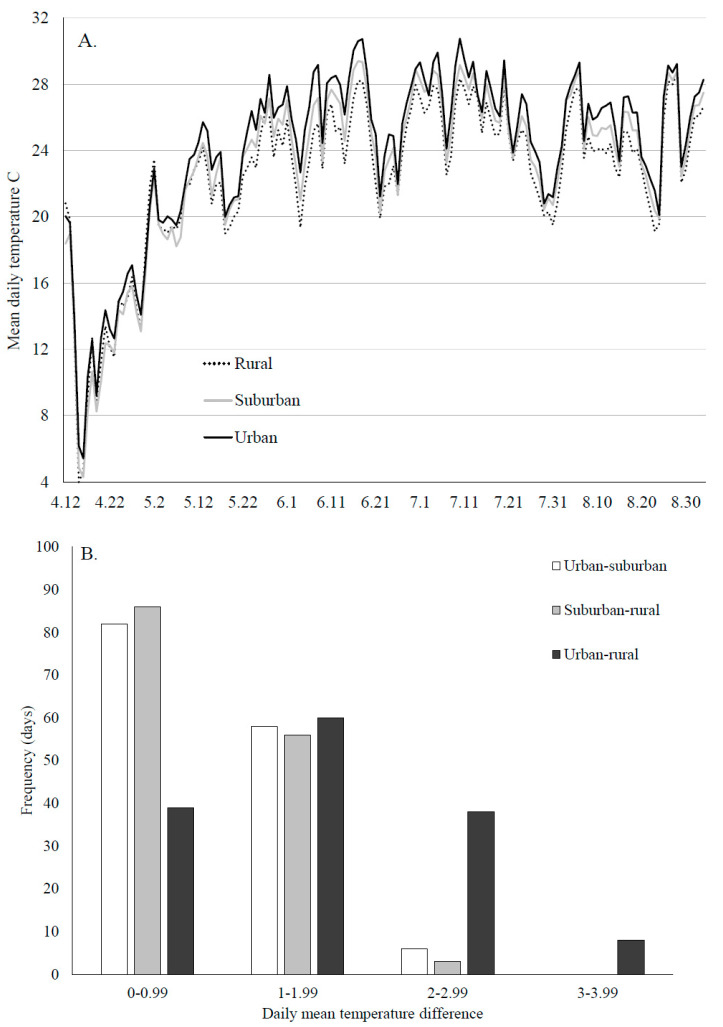
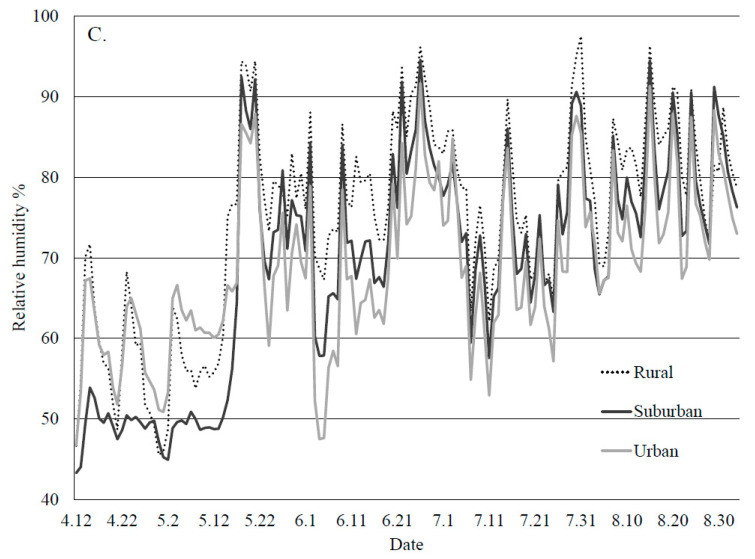
Temperature and humidity were measured every three hours at each site, directly next to one of the ovicups, in 2018. (A) Daily mean temperatures by land use type, (B) a histogram of the frequency that differences in daily mean temperatures between each land use type reached levels that may be sufficient to alter population growth rates, (C) daily mean relative humidity.


