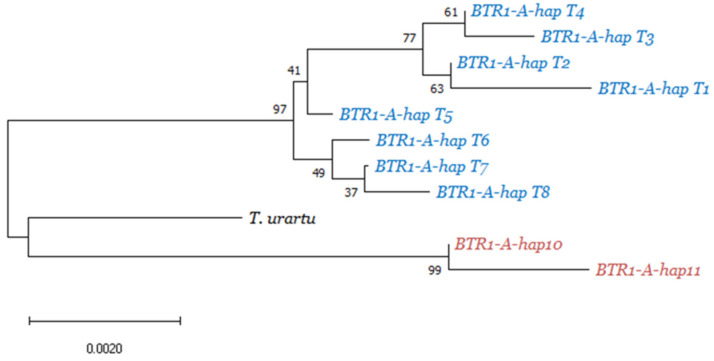
Figure 2.
Phylogram based on BTR1-A variants showing clear differentiation between the T. turgidum (red) and T. timopheevii (blue) species, relative to the diploid T. urartu paraphyletic outgroup. The phylogram illustrates the close relationship between T. araraticum haplotype BTR1-A-hapT7 and domesticated timopheevii haplotype BTR1-A-hapT8. Local bootstrap values after 1000 replicates are indicated at the nodes.

